Immigrants from Uganda vs Honduran Unemployment Among Ages 16 to 19 years
COMPARE
Immigrants from Uganda
Honduran
Unemployment Among Ages 16 to 19 years
Unemployment Among Ages 16 to 19 years Comparison
Immigrants from Uganda
Hondurans
16.5%
UNEMPLOYMENT AMONG AGES 16 TO 19 YEARS
99.4/ 100
METRIC RATING
58th/ 347
METRIC RANK
19.2%
UNEMPLOYMENT AMONG AGES 16 TO 19 YEARS
0.1/ 100
METRIC RATING
270th/ 347
METRIC RANK
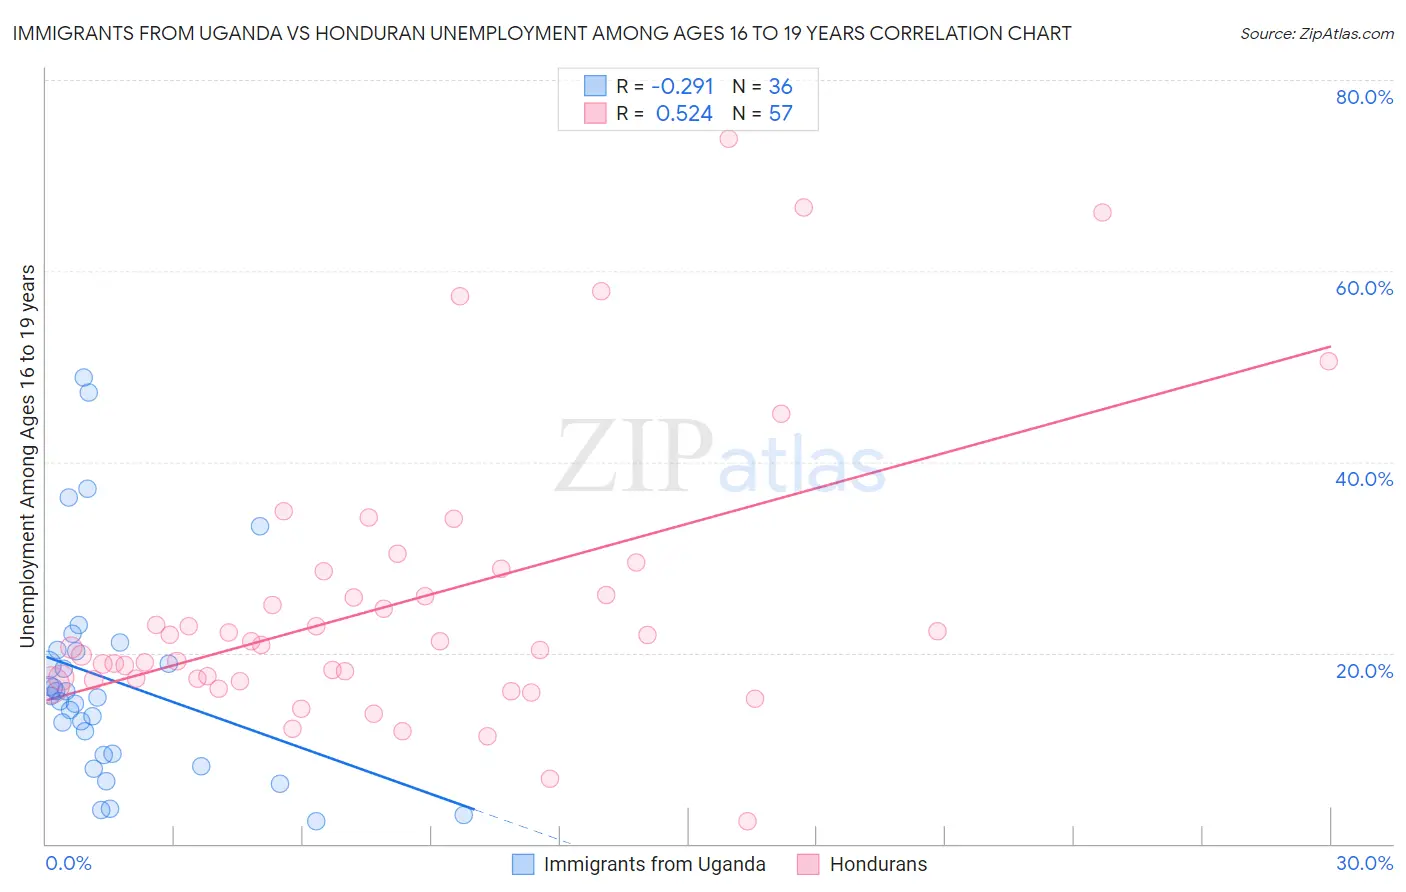
Immigrants from Uganda vs Honduran Unemployment Among Ages 16 to 19 years Correlation Chart
The statistical analysis conducted on geographies consisting of 124,056,467 people shows a weak negative correlation between the proportion of Immigrants from Uganda and unemployment rate among population between the ages 16 and 19 in the United States with a correlation coefficient (R) of -0.291 and weighted average of 16.5%. Similarly, the statistical analysis conducted on geographies consisting of 343,682,846 people shows a substantial positive correlation between the proportion of Hondurans and unemployment rate among population between the ages 16 and 19 in the United States with a correlation coefficient (R) of 0.524 and weighted average of 19.2%, a difference of 16.0%.
Unemployment Among Ages 16 to 19 years Correlation Summary
| Measurement | Immigrants from Uganda | Honduran |
| Minimum | 2.4% | 2.3% |
| Maximum | 48.9% | 73.9% |
| Range | 46.5% | 71.6% |
| Mean | 17.1% | 25.1% |
| Median | 15.4% | 20.8% |
| Interquartile 25% (IQ1) | 9.3% | 17.2% |
| Interquartile 75% (IQ3) | 20.2% | 27.3% |
| Interquartile Range (IQR) | 10.9% | 10.1% |
| Standard Deviation (Sample) | 11.3% | 14.8% |
| Standard Deviation (Population) | 11.1% | 14.6% |
Similar Demographics by Unemployment Among Ages 16 to 19 years
Demographics Similar to Immigrants from Uganda by Unemployment Among Ages 16 to 19 years
In terms of unemployment among ages 16 to 19 years, the demographic groups most similar to Immigrants from Uganda are Immigrants from Jordan (16.5%, a difference of 0.050%), Irish (16.5%, a difference of 0.050%), Menominee (16.6%, a difference of 0.22%), Immigrants from Cuba (16.6%, a difference of 0.28%), and Sri Lankan (16.5%, a difference of 0.33%).
| Demographics | Rating | Rank | Unemployment Among Ages 16 to 19 years |
| Lebanese | 99.6 /100 | #51 | Exceptional 16.4% |
| Welsh | 99.6 /100 | #52 | Exceptional 16.4% |
| Slovenes | 99.6 /100 | #53 | Exceptional 16.4% |
| British | 99.5 /100 | #54 | Exceptional 16.5% |
| Czechoslovakians | 99.5 /100 | #55 | Exceptional 16.5% |
| Sri Lankans | 99.5 /100 | #56 | Exceptional 16.5% |
| Immigrants | Jordan | 99.4 /100 | #57 | Exceptional 16.5% |
| Immigrants | Uganda | 99.4 /100 | #58 | Exceptional 16.5% |
| Irish | 99.4 /100 | #59 | Exceptional 16.5% |
| Menominee | 99.3 /100 | #60 | Exceptional 16.6% |
| Immigrants | Cuba | 99.2 /100 | #61 | Exceptional 16.6% |
| Macedonians | 99.2 /100 | #62 | Exceptional 16.6% |
| Scotch-Irish | 99.1 /100 | #63 | Exceptional 16.6% |
| Northern Europeans | 99.0 /100 | #64 | Exceptional 16.6% |
| Immigrants | Japan | 98.9 /100 | #65 | Exceptional 16.6% |
Demographics Similar to Hondurans by Unemployment Among Ages 16 to 19 years
In terms of unemployment among ages 16 to 19 years, the demographic groups most similar to Hondurans are Lumbee (19.1%, a difference of 0.18%), Immigrants from El Salvador (19.1%, a difference of 0.26%), Blackfeet (19.2%, a difference of 0.38%), Hispanic or Latino (19.2%, a difference of 0.50%), and Israeli (19.0%, a difference of 0.54%).
| Demographics | Rating | Rank | Unemployment Among Ages 16 to 19 years |
| Cree | 0.1 /100 | #263 | Tragic 19.0% |
| Yaqui | 0.1 /100 | #264 | Tragic 19.0% |
| Choctaw | 0.1 /100 | #265 | Tragic 19.0% |
| Immigrants | Honduras | 0.1 /100 | #266 | Tragic 19.0% |
| Israelis | 0.1 /100 | #267 | Tragic 19.0% |
| Immigrants | El Salvador | 0.1 /100 | #268 | Tragic 19.1% |
| Lumbee | 0.1 /100 | #269 | Tragic 19.1% |
| Hondurans | 0.1 /100 | #270 | Tragic 19.2% |
| Blackfeet | 0.0 /100 | #271 | Tragic 19.2% |
| Hispanics or Latinos | 0.0 /100 | #272 | Tragic 19.2% |
| Immigrants | Panama | 0.0 /100 | #273 | Tragic 19.3% |
| Shoshone | 0.0 /100 | #274 | Tragic 19.3% |
| Paraguayans | 0.0 /100 | #275 | Tragic 19.4% |
| Immigrants | Latin America | 0.0 /100 | #276 | Tragic 19.4% |
| Immigrants | Western Africa | 0.0 /100 | #277 | Tragic 19.4% |