Immigrants from Uganda vs Honduran Householder Income Ages 25 - 44 years
COMPARE
Immigrants from Uganda
Honduran
Householder Income Ages 25 - 44 years
Householder Income Ages 25 - 44 years Comparison
Immigrants from Uganda
Hondurans
$95,698
HOUSEHOLDER INCOME AGES 25 - 44 YEARS
65.2/ 100
METRIC RATING
157th/ 347
METRIC RANK
$78,540
HOUSEHOLDER INCOME AGES 25 - 44 YEARS
0.0/ 100
METRIC RATING
319th/ 347
METRIC RANK
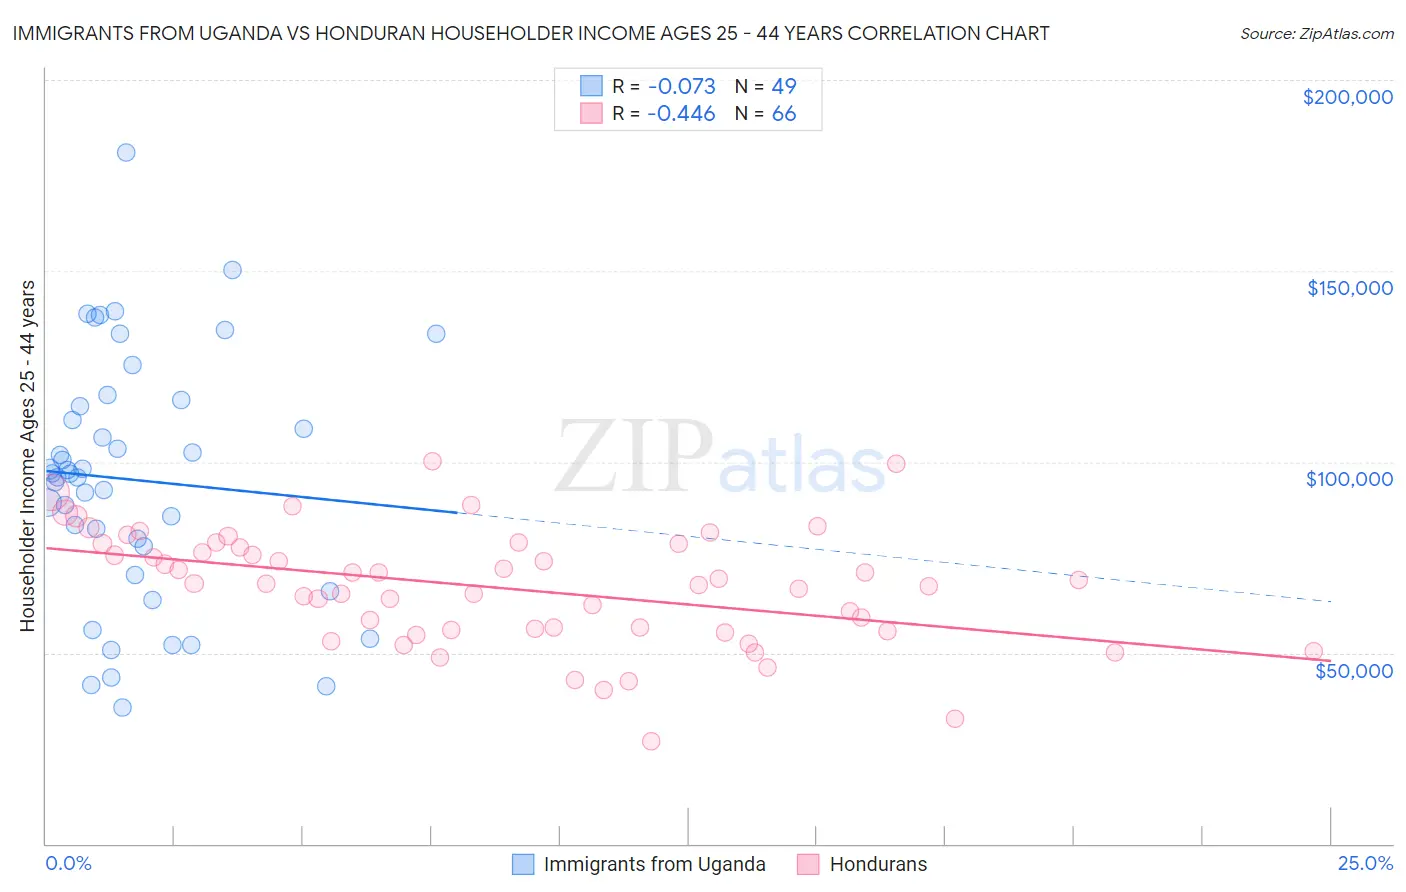
Immigrants from Uganda vs Honduran Householder Income Ages 25 - 44 years Correlation Chart
The statistical analysis conducted on geographies consisting of 125,922,646 people shows a slight negative correlation between the proportion of Immigrants from Uganda and household income with householder between the ages 25 and 44 in the United States with a correlation coefficient (R) of -0.073 and weighted average of $95,698. Similarly, the statistical analysis conducted on geographies consisting of 357,079,818 people shows a moderate negative correlation between the proportion of Hondurans and household income with householder between the ages 25 and 44 in the United States with a correlation coefficient (R) of -0.446 and weighted average of $78,540, a difference of 21.8%.
Householder Income Ages 25 - 44 years Correlation Summary
| Measurement | Immigrants from Uganda | Honduran |
| Minimum | $35,667 | $26,956 |
| Maximum | $180,909 | $100,173 |
| Range | $145,242 | $73,217 |
| Mean | $95,288 | $67,051 |
| Median | $96,887 | $68,041 |
| Interquartile 25% (IQ1) | $74,128 | $56,015 |
| Interquartile 75% (IQ3) | $115,286 | $78,438 |
| Interquartile Range (IQR) | $41,158 | $22,423 |
| Standard Deviation (Sample) | $32,223 | $15,191 |
| Standard Deviation (Population) | $31,892 | $15,075 |
Similar Demographics by Householder Income Ages 25 - 44 years
Demographics Similar to Immigrants from Uganda by Householder Income Ages 25 - 44 years
In terms of householder income ages 25 - 44 years, the demographic groups most similar to Immigrants from Uganda are Scandinavian ($95,596, a difference of 0.11%), Costa Rican ($95,565, a difference of 0.14%), Icelander ($95,560, a difference of 0.14%), Immigrants from Portugal ($95,512, a difference of 0.19%), and Swiss ($95,511, a difference of 0.20%).
| Demographics | Rating | Rank | Householder Income Ages 25 - 44 years |
| Ugandans | 76.2 /100 | #150 | Good $96,667 |
| Czechs | 74.8 /100 | #151 | Good $96,525 |
| South American Indians | 74.5 /100 | #152 | Good $96,497 |
| Slovenes | 73.9 /100 | #153 | Good $96,439 |
| Slavs | 73.2 /100 | #154 | Good $96,377 |
| Moroccans | 70.3 /100 | #155 | Good $96,117 |
| Immigrants | Germany | 67.9 /100 | #156 | Good $95,913 |
| Immigrants | Uganda | 65.2 /100 | #157 | Good $95,698 |
| Scandinavians | 63.9 /100 | #158 | Good $95,596 |
| Costa Ricans | 63.5 /100 | #159 | Good $95,565 |
| Icelanders | 63.4 /100 | #160 | Good $95,560 |
| Immigrants | Portugal | 62.8 /100 | #161 | Good $95,512 |
| Swiss | 62.8 /100 | #162 | Good $95,511 |
| Immigrants | Saudi Arabia | 62.0 /100 | #163 | Good $95,450 |
| South Americans | 60.9 /100 | #164 | Good $95,362 |
Demographics Similar to Hondurans by Householder Income Ages 25 - 44 years
In terms of householder income ages 25 - 44 years, the demographic groups most similar to Hondurans are Immigrants from Mexico ($78,809, a difference of 0.34%), U.S. Virgin Islander ($78,911, a difference of 0.47%), Choctaw ($78,168, a difference of 0.48%), African ($78,986, a difference of 0.57%), and Ottawa ($79,012, a difference of 0.60%).
| Demographics | Rating | Rank | Householder Income Ages 25 - 44 years |
| Immigrants | Haiti | 0.0 /100 | #312 | Tragic $79,391 |
| Menominee | 0.0 /100 | #313 | Tragic $79,358 |
| Cheyenne | 0.0 /100 | #314 | Tragic $79,152 |
| Ottawa | 0.0 /100 | #315 | Tragic $79,012 |
| Africans | 0.0 /100 | #316 | Tragic $78,986 |
| U.S. Virgin Islanders | 0.0 /100 | #317 | Tragic $78,911 |
| Immigrants | Mexico | 0.0 /100 | #318 | Tragic $78,809 |
| Hondurans | 0.0 /100 | #319 | Tragic $78,540 |
| Choctaw | 0.0 /100 | #320 | Tragic $78,168 |
| Immigrants | Zaire | 0.0 /100 | #321 | Tragic $78,045 |
| Chickasaw | 0.0 /100 | #322 | Tragic $77,929 |
| Immigrants | Honduras | 0.0 /100 | #323 | Tragic $77,328 |
| Dutch West Indians | 0.0 /100 | #324 | Tragic $77,260 |
| Sioux | 0.0 /100 | #325 | Tragic $77,089 |
| Houma | 0.0 /100 | #326 | Tragic $77,044 |