Immigrants from Trinidad and Tobago vs European Unemployment Among Ages 16 to 19 years
COMPARE
Immigrants from Trinidad and Tobago
European
Unemployment Among Ages 16 to 19 years
Unemployment Among Ages 16 to 19 years Comparison
Immigrants from Trinidad and Tobago
Europeans
23.1%
UNEMPLOYMENT AMONG AGES 16 TO 19 YEARS
0.0/ 100
METRIC RATING
326th/ 347
METRIC RANK
16.1%
UNEMPLOYMENT AMONG AGES 16 TO 19 YEARS
99.9/ 100
METRIC RATING
32nd/ 347
METRIC RANK
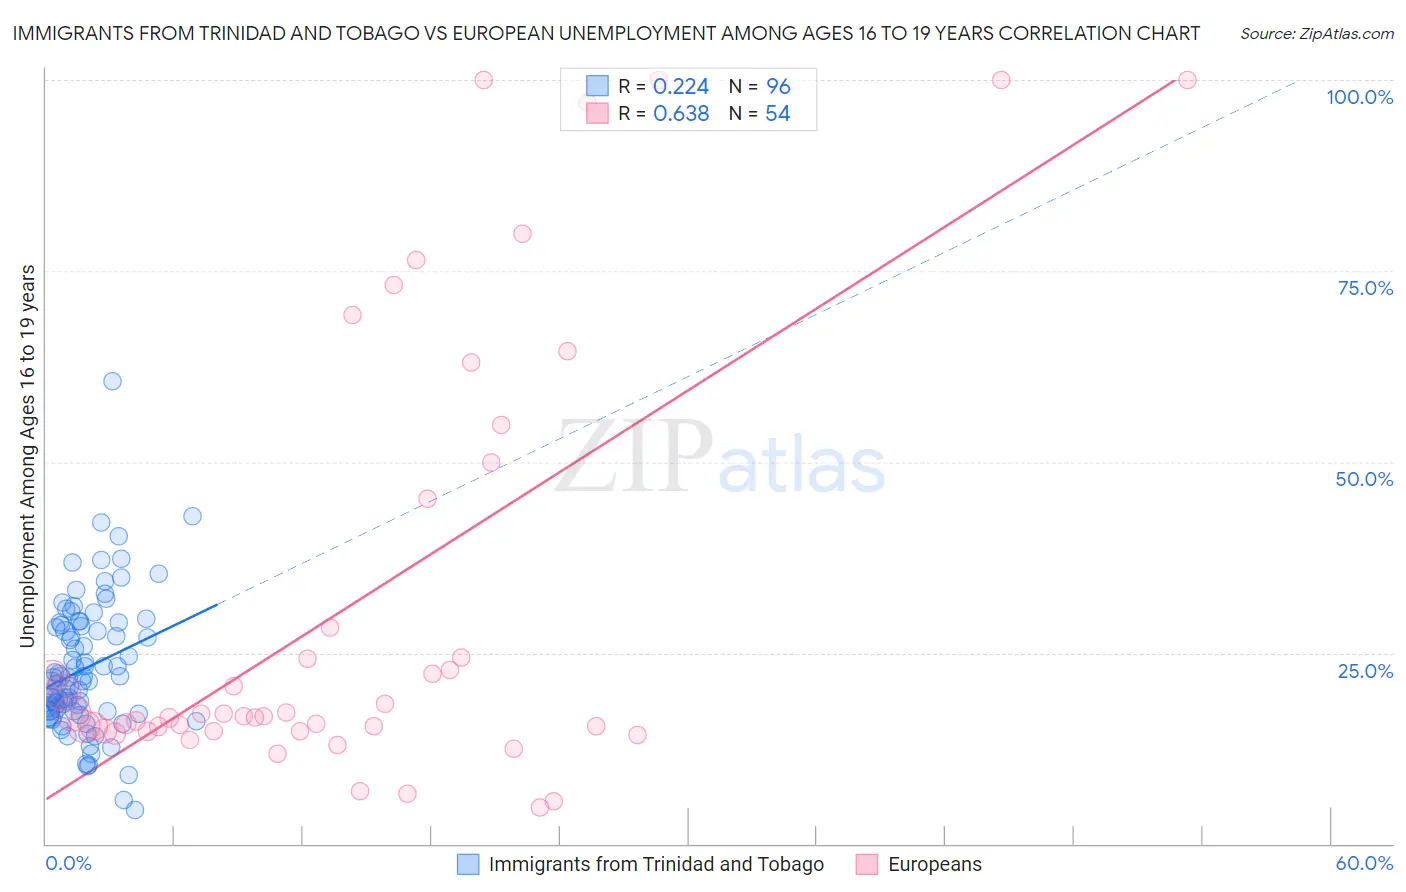
Immigrants from Trinidad and Tobago vs European Unemployment Among Ages 16 to 19 years Correlation Chart
The statistical analysis conducted on geographies consisting of 216,632,752 people shows a weak positive correlation between the proportion of Immigrants from Trinidad and Tobago and unemployment rate among population between the ages 16 and 19 in the United States with a correlation coefficient (R) of 0.224 and weighted average of 23.1%. Similarly, the statistical analysis conducted on geographies consisting of 503,228,769 people shows a significant positive correlation between the proportion of Europeans and unemployment rate among population between the ages 16 and 19 in the United States with a correlation coefficient (R) of 0.638 and weighted average of 16.1%, a difference of 43.2%.
Unemployment Among Ages 16 to 19 years Correlation Summary
| Measurement | Immigrants from Trinidad and Tobago | European |
| Minimum | 4.5% | 4.8% |
| Maximum | 60.5% | 100.0% |
| Range | 56.0% | 95.2% |
| Mean | 23.0% | 31.7% |
| Median | 21.5% | 16.9% |
| Interquartile 25% (IQ1) | 17.4% | 14.8% |
| Interquartile 75% (IQ3) | 28.5% | 45.1% |
| Interquartile Range (IQR) | 11.1% | 30.3% |
| Standard Deviation (Sample) | 8.8% | 28.9% |
| Standard Deviation (Population) | 8.7% | 28.6% |
Similar Demographics by Unemployment Among Ages 16 to 19 years
Demographics Similar to Immigrants from Trinidad and Tobago by Unemployment Among Ages 16 to 19 years
In terms of unemployment among ages 16 to 19 years, the demographic groups most similar to Immigrants from Trinidad and Tobago are Pima (23.1%, a difference of 0.26%), Immigrants from Dominican Republic (23.3%, a difference of 0.93%), Trinidadian and Tobagonian (22.6%, a difference of 2.0%), Tlingit-Haida (23.5%, a difference of 2.0%), and Immigrants from Armenia (22.6%, a difference of 2.1%).
| Demographics | Rating | Rank | Unemployment Among Ages 16 to 19 years |
| Immigrants | West Indies | 0.0 /100 | #319 | Tragic 22.2% |
| Cheyenne | 0.0 /100 | #320 | Tragic 22.3% |
| West Indians | 0.0 /100 | #321 | Tragic 22.4% |
| Barbadians | 0.0 /100 | #322 | Tragic 22.5% |
| Yakama | 0.0 /100 | #323 | Tragic 22.5% |
| Immigrants | Armenia | 0.0 /100 | #324 | Tragic 22.6% |
| Trinidadians and Tobagonians | 0.0 /100 | #325 | Tragic 22.6% |
| Immigrants | Trinidad and Tobago | 0.0 /100 | #326 | Tragic 23.1% |
| Pima | 0.0 /100 | #327 | Tragic 23.1% |
| Immigrants | Dominican Republic | 0.0 /100 | #328 | Tragic 23.3% |
| Tlingit-Haida | 0.0 /100 | #329 | Tragic 23.5% |
| Dominicans | 0.0 /100 | #330 | Tragic 23.6% |
| British West Indians | 0.0 /100 | #331 | Tragic 24.0% |
| Immigrants | Barbados | 0.0 /100 | #332 | Tragic 24.0% |
| Paiute | 0.0 /100 | #333 | Tragic 24.4% |
Demographics Similar to Europeans by Unemployment Among Ages 16 to 19 years
In terms of unemployment among ages 16 to 19 years, the demographic groups most similar to Europeans are English (16.1%, a difference of 0.39%), Kenyan (16.1%, a difference of 0.45%), Chinese (16.0%, a difference of 0.48%), Immigrants from Kenya (16.2%, a difference of 0.51%), and Jordanian (16.0%, a difference of 0.54%).
| Demographics | Rating | Rank | Unemployment Among Ages 16 to 19 years |
| Filipinos | 100.0 /100 | #25 | Exceptional 15.9% |
| Dutch | 100.0 /100 | #26 | Exceptional 15.9% |
| Immigrants | Sudan | 99.9 /100 | #27 | Exceptional 16.0% |
| Jordanians | 99.9 /100 | #28 | Exceptional 16.0% |
| Chinese | 99.9 /100 | #29 | Exceptional 16.0% |
| Kenyans | 99.9 /100 | #30 | Exceptional 16.1% |
| English | 99.9 /100 | #31 | Exceptional 16.1% |
| Europeans | 99.9 /100 | #32 | Exceptional 16.1% |
| Immigrants | Kenya | 99.9 /100 | #33 | Exceptional 16.2% |
| Pennsylvania Germans | 99.9 /100 | #34 | Exceptional 16.2% |
| Scottish | 99.8 /100 | #35 | Exceptional 16.2% |
| Immigrants | South Central Asia | 99.8 /100 | #36 | Exceptional 16.2% |
| Immigrants | Congo | 99.8 /100 | #37 | Exceptional 16.3% |
| Bulgarians | 99.8 /100 | #38 | Exceptional 16.3% |
| Croatians | 99.8 /100 | #39 | Exceptional 16.3% |