Cree vs European Disability Age Under 5
COMPARE
Cree
European
Disability Age Under 5
Disability Age Under 5 Comparison
Cree
Europeans
1.4%
DISABILITY AGE UNDER 5
0.1/ 100
METRIC RATING
267th/ 347
METRIC RANK
1.5%
DISABILITY AGE UNDER 5
0.0/ 100
METRIC RATING
284th/ 347
METRIC RANK
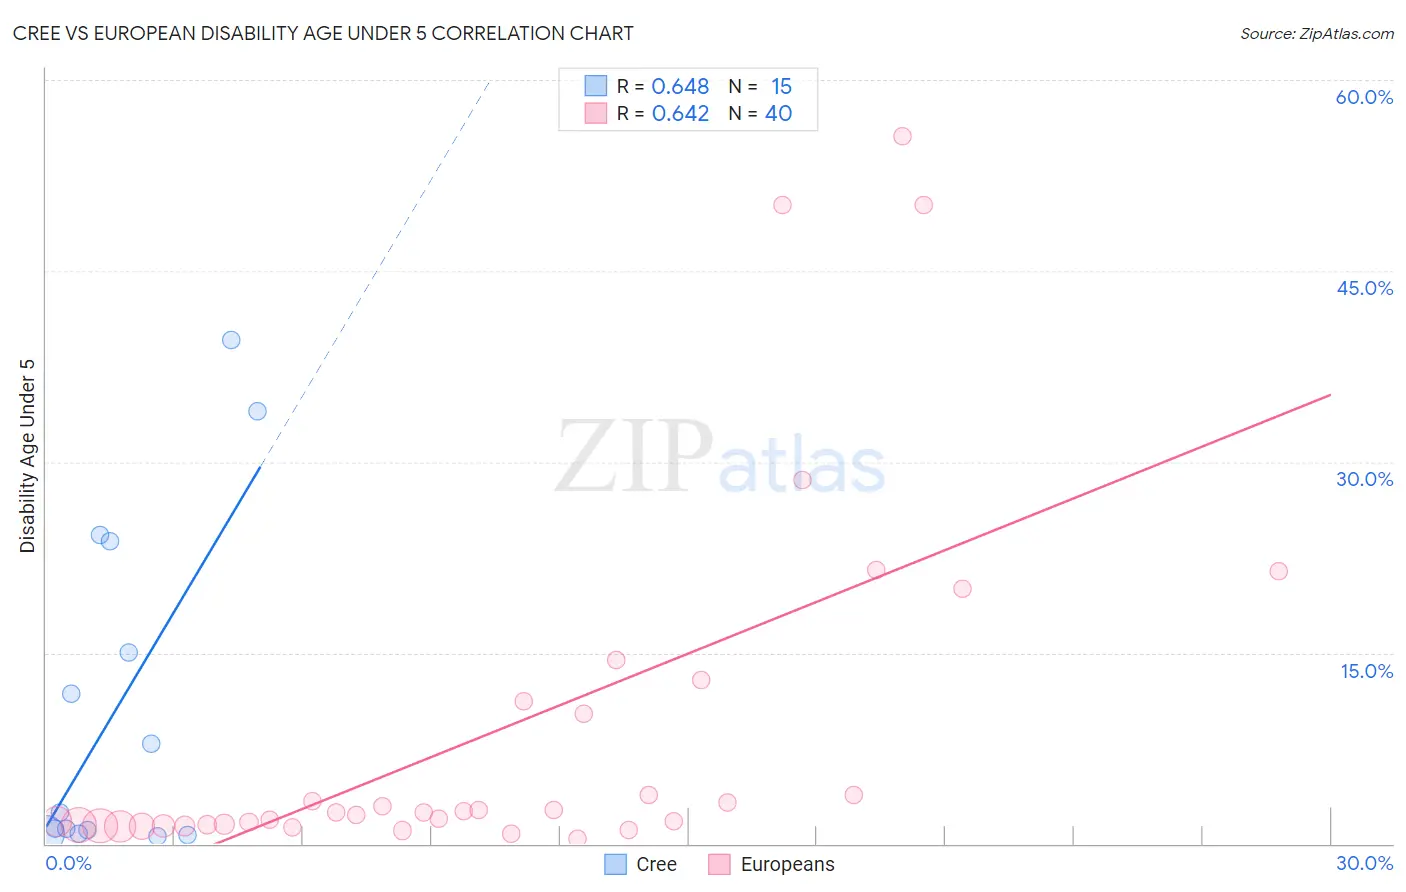
Cree vs European Disability Age Under 5 Correlation Chart
The statistical analysis conducted on geographies consisting of 59,931,307 people shows a significant positive correlation between the proportion of Cree and percentage of population with a disability under the age of 5 in the United States with a correlation coefficient (R) of 0.648 and weighted average of 1.4%. Similarly, the statistical analysis conducted on geographies consisting of 258,994,834 people shows a significant positive correlation between the proportion of Europeans and percentage of population with a disability under the age of 5 in the United States with a correlation coefficient (R) of 0.642 and weighted average of 1.5%, a difference of 6.3%.
Disability Age Under 5 Correlation Summary
| Measurement | Cree | European |
| Minimum | 0.57% | 0.42% |
| Maximum | 39.6% | 55.6% |
| Range | 39.0% | 55.1% |
| Mean | 11.0% | 8.8% |
| Median | 2.5% | 2.4% |
| Interquartile 25% (IQ1) | 0.80% | 1.4% |
| Interquartile 75% (IQ3) | 23.8% | 10.7% |
| Interquartile Range (IQR) | 23.0% | 9.2% |
| Standard Deviation (Sample) | 13.3% | 14.2% |
| Standard Deviation (Population) | 12.9% | 14.0% |
Demographics Similar to Cree and Europeans by Disability Age Under 5
In terms of disability age under 5, the demographic groups most similar to Cree are Immigrants from Germany (1.4%, a difference of 0.52%), Carpatho Rusyn (1.4%, a difference of 0.55%), Belgian (1.4%, a difference of 0.58%), Austrian (1.4%, a difference of 0.76%), and Immigrants from North America (1.4%, a difference of 0.89%). Similarly, the demographic groups most similar to Europeans are Delaware (1.5%, a difference of 0.050%), Cheyenne (1.5%, a difference of 0.25%), Czechoslovakian (1.5%, a difference of 0.59%), Croatian (1.5%, a difference of 1.2%), and British (1.5%, a difference of 2.2%).
| Demographics | Rating | Rank | Disability Age Under 5 |
| Carpatho Rusyns | 0.1 /100 | #265 | Tragic 1.4% |
| Immigrants | Germany | 0.1 /100 | #266 | Tragic 1.4% |
| Cree | 0.1 /100 | #267 | Tragic 1.4% |
| Belgians | 0.1 /100 | #268 | Tragic 1.4% |
| Austrians | 0.1 /100 | #269 | Tragic 1.4% |
| Immigrants | North America | 0.1 /100 | #270 | Tragic 1.4% |
| Immigrants | Canada | 0.1 /100 | #271 | Tragic 1.4% |
| Blacks/African Americans | 0.1 /100 | #272 | Tragic 1.4% |
| Alaskan Athabascans | 0.1 /100 | #273 | Tragic 1.5% |
| Iroquois | 0.0 /100 | #274 | Tragic 1.5% |
| Brazilians | 0.0 /100 | #275 | Tragic 1.5% |
| Greeks | 0.0 /100 | #276 | Tragic 1.5% |
| Canadians | 0.0 /100 | #277 | Tragic 1.5% |
| Kiowa | 0.0 /100 | #278 | Tragic 1.5% |
| Danes | 0.0 /100 | #279 | Tragic 1.5% |
| British | 0.0 /100 | #280 | Tragic 1.5% |
| Czechoslovakians | 0.0 /100 | #281 | Tragic 1.5% |
| Cheyenne | 0.0 /100 | #282 | Tragic 1.5% |
| Delaware | 0.0 /100 | #283 | Tragic 1.5% |
| Europeans | 0.0 /100 | #284 | Tragic 1.5% |
| Croatians | 0.0 /100 | #285 | Tragic 1.5% |