Immigrants from Trinidad and Tobago vs Czechoslovakian Vision Disability
COMPARE
Immigrants from Trinidad and Tobago
Czechoslovakian
Vision Disability
Vision Disability Comparison
Immigrants from Trinidad and Tobago
Czechoslovakians
2.3%
VISION DISABILITY
6.1/ 100
METRIC RATING
216th/ 347
METRIC RANK
2.2%
VISION DISABILITY
21.6/ 100
METRIC RATING
198th/ 347
METRIC RANK
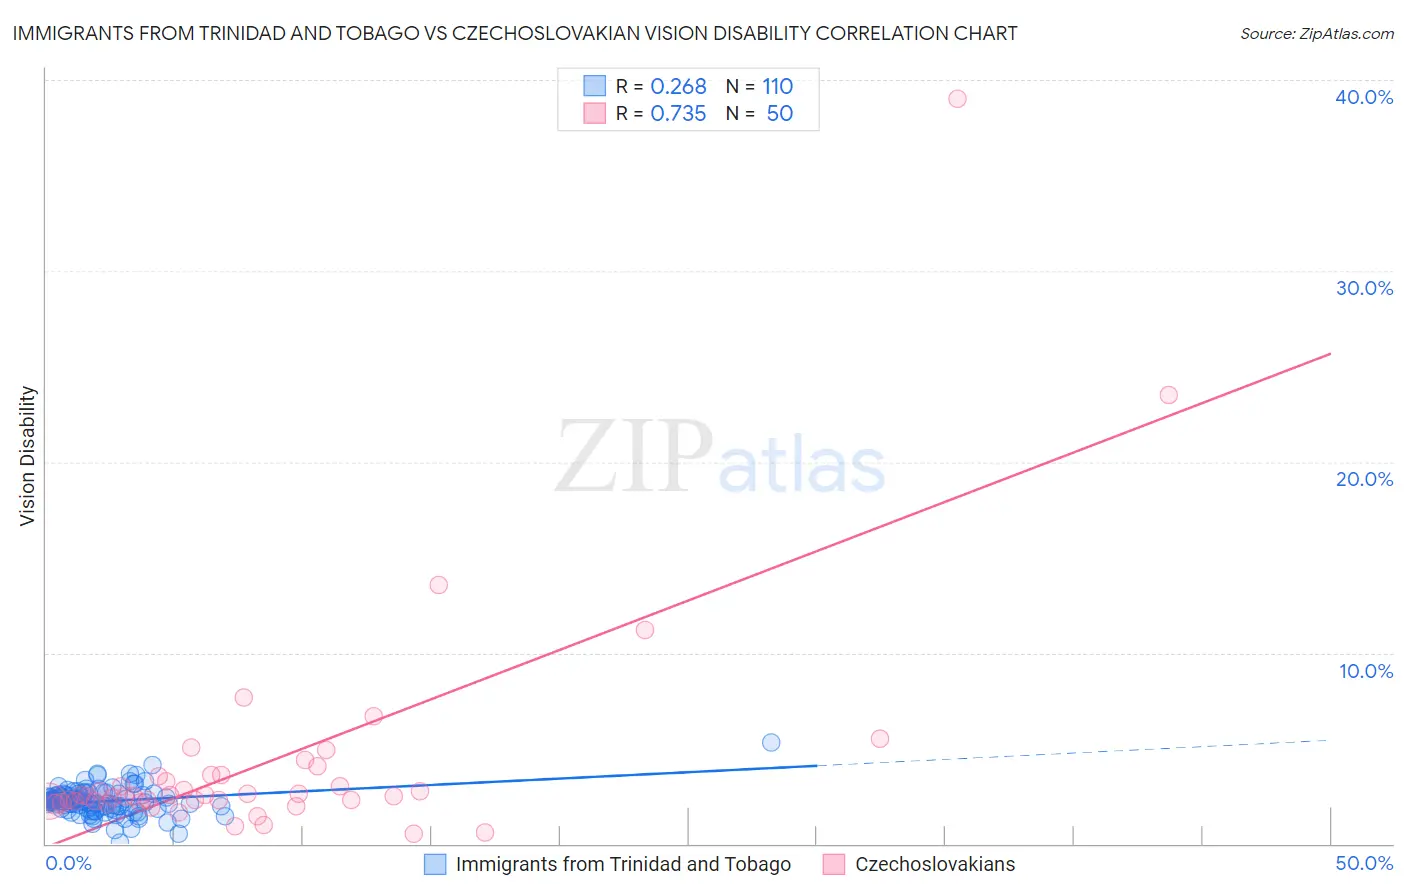
Immigrants from Trinidad and Tobago vs Czechoslovakian Vision Disability Correlation Chart
The statistical analysis conducted on geographies consisting of 223,458,050 people shows a weak positive correlation between the proportion of Immigrants from Trinidad and Tobago and percentage of population with vision disability in the United States with a correlation coefficient (R) of 0.268 and weighted average of 2.3%. Similarly, the statistical analysis conducted on geographies consisting of 368,413,881 people shows a strong positive correlation between the proportion of Czechoslovakians and percentage of population with vision disability in the United States with a correlation coefficient (R) of 0.735 and weighted average of 2.2%, a difference of 2.2%.
Vision Disability Correlation Summary
| Measurement | Immigrants from Trinidad and Tobago | Czechoslovakian |
| Minimum | 0.061% | 0.51% |
| Maximum | 5.3% | 39.0% |
| Range | 5.3% | 38.5% |
| Mean | 2.2% | 4.3% |
| Median | 2.2% | 2.5% |
| Interquartile 25% (IQ1) | 1.8% | 2.2% |
| Interquartile 75% (IQ3) | 2.6% | 3.6% |
| Interquartile Range (IQR) | 0.74% | 1.4% |
| Standard Deviation (Sample) | 0.72% | 6.2% |
| Standard Deviation (Population) | 0.72% | 6.2% |
Demographics Similar to Immigrants from Trinidad and Tobago and Czechoslovakians by Vision Disability
In terms of vision disability, the demographic groups most similar to Immigrants from Trinidad and Tobago are Barbadian (2.3%, a difference of 0.28%), Nigerian (2.3%, a difference of 0.29%), Trinidadian and Tobagonian (2.2%, a difference of 0.50%), Immigrants from Ghana (2.2%, a difference of 0.63%), and Bermudan (2.2%, a difference of 0.64%). Similarly, the demographic groups most similar to Czechoslovakians are Ghanaian (2.2%, a difference of 0.020%), Immigrants from El Salvador (2.2%, a difference of 0.050%), Immigrants from Thailand (2.2%, a difference of 0.14%), Slovak (2.2%, a difference of 0.27%), and Immigrants from Zaire (2.2%, a difference of 0.35%).
| Demographics | Rating | Rank | Vision Disability |
| Ghanaians | 21.8 /100 | #197 | Fair 2.2% |
| Czechoslovakians | 21.6 /100 | #198 | Fair 2.2% |
| Immigrants | El Salvador | 21.0 /100 | #199 | Fair 2.2% |
| Immigrants | Thailand | 20.1 /100 | #200 | Fair 2.2% |
| Slovaks | 18.8 /100 | #201 | Poor 2.2% |
| Immigrants | Zaire | 18.0 /100 | #202 | Poor 2.2% |
| Dutch | 17.1 /100 | #203 | Poor 2.2% |
| Immigrants | Guyana | 15.9 /100 | #204 | Poor 2.2% |
| Samoans | 15.7 /100 | #205 | Poor 2.2% |
| Pennsylvania Germans | 14.5 /100 | #206 | Poor 2.2% |
| Immigrants | Nigeria | 13.5 /100 | #207 | Poor 2.2% |
| Germans | 13.4 /100 | #208 | Poor 2.2% |
| Immigrants | Brazil | 13.1 /100 | #209 | Poor 2.2% |
| Immigrants | Uruguay | 11.5 /100 | #210 | Poor 2.2% |
| Indonesians | 9.5 /100 | #211 | Tragic 2.2% |
| Bermudans | 9.0 /100 | #212 | Tragic 2.2% |
| Immigrants | Ghana | 8.9 /100 | #213 | Tragic 2.2% |
| Trinidadians and Tobagonians | 8.2 /100 | #214 | Tragic 2.2% |
| Nigerians | 7.2 /100 | #215 | Tragic 2.3% |
| Immigrants | Trinidad and Tobago | 6.1 /100 | #216 | Tragic 2.3% |
| Barbadians | 5.1 /100 | #217 | Tragic 2.3% |