Immigrants from Sweden vs Immigrants from Lebanon Male Disability
COMPARE
Immigrants from Sweden
Immigrants from Lebanon
Male Disability
Male Disability Comparison
Immigrants from Sweden
Immigrants from Lebanon
10.7%
MALE DISABILITY
96.9/ 100
METRIC RATING
94th/ 347
METRIC RANK
10.5%
MALE DISABILITY
98.8/ 100
METRIC RATING
74th/ 347
METRIC RANK
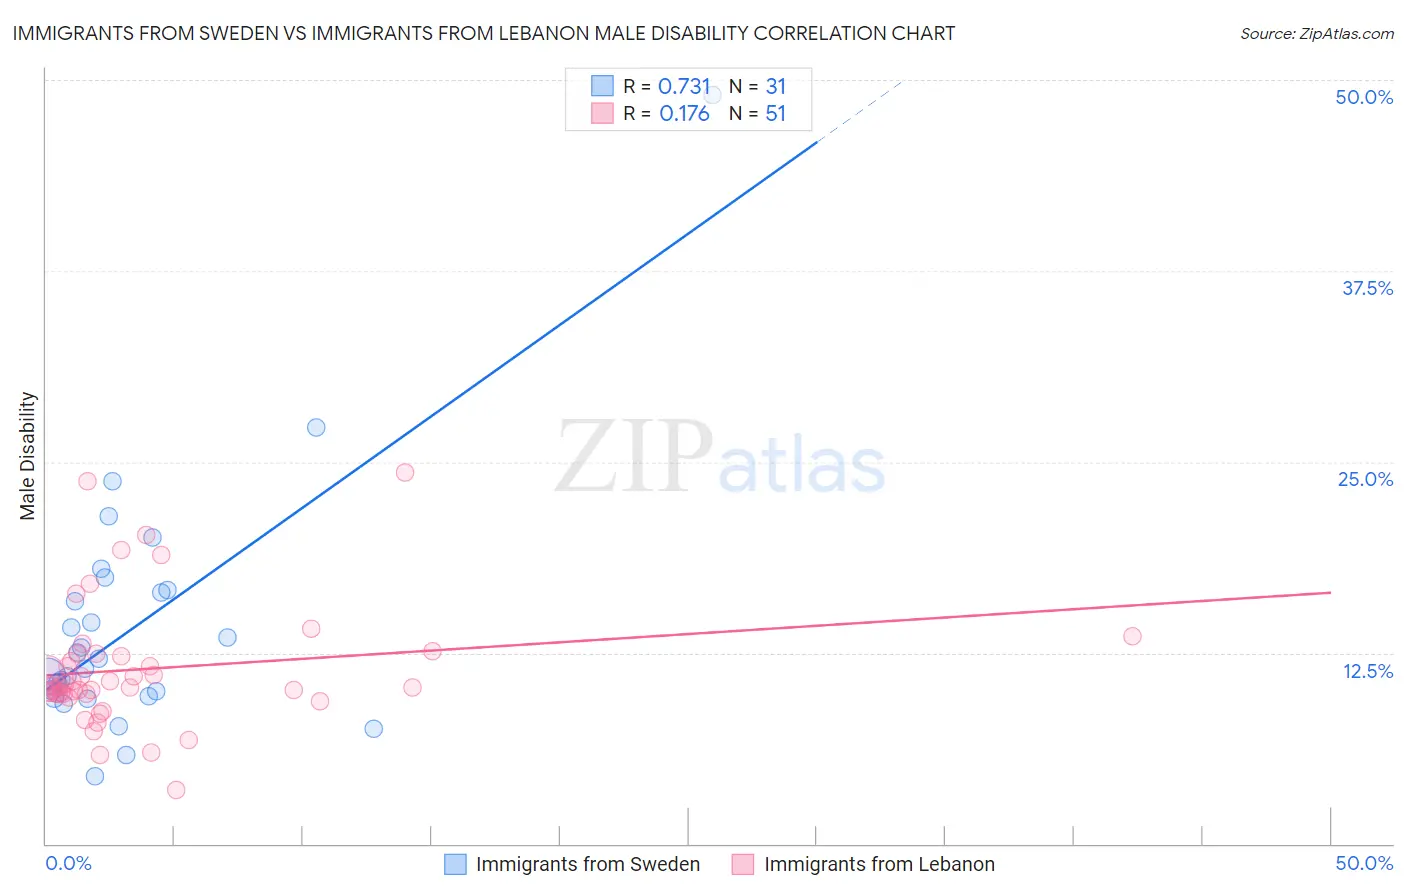
Immigrants from Sweden vs Immigrants from Lebanon Male Disability Correlation Chart
The statistical analysis conducted on geographies consisting of 164,748,272 people shows a strong positive correlation between the proportion of Immigrants from Sweden and percentage of males with a disability in the United States with a correlation coefficient (R) of 0.731 and weighted average of 10.7%. Similarly, the statistical analysis conducted on geographies consisting of 217,152,652 people shows a poor positive correlation between the proportion of Immigrants from Lebanon and percentage of males with a disability in the United States with a correlation coefficient (R) of 0.176 and weighted average of 10.5%, a difference of 1.4%.
Male Disability Correlation Summary
| Measurement | Immigrants from Sweden | Immigrants from Lebanon |
| Minimum | 4.4% | 3.6% |
| Maximum | 49.0% | 24.3% |
| Range | 44.6% | 20.7% |
| Mean | 14.3% | 11.4% |
| Median | 12.1% | 10.3% |
| Interquartile 25% (IQ1) | 9.7% | 9.9% |
| Interquartile 75% (IQ3) | 16.6% | 12.4% |
| Interquartile Range (IQR) | 6.9% | 2.6% |
| Standard Deviation (Sample) | 8.2% | 4.1% |
| Standard Deviation (Population) | 8.1% | 4.0% |
Demographics Similar to Immigrants from Sweden and Immigrants from Lebanon by Male Disability
In terms of male disability, the demographic groups most similar to Immigrants from Sweden are Immigrants from St. Vincent and the Grenadines (10.7%, a difference of 0.11%), Palestinian (10.7%, a difference of 0.24%), Immigrants from France (10.6%, a difference of 0.38%), Immigrants from Morocco (10.6%, a difference of 0.42%), and Immigrants from Nicaragua (10.6%, a difference of 0.47%). Similarly, the demographic groups most similar to Immigrants from Lebanon are Sierra Leonean (10.5%, a difference of 0.12%), Immigrants from Sierra Leone (10.5%, a difference of 0.16%), Laotian (10.6%, a difference of 0.21%), Immigrants from Russia (10.6%, a difference of 0.24%), and Zimbabwean (10.6%, a difference of 0.47%).
| Demographics | Rating | Rank | Male Disability |
| Immigrants | Lebanon | 98.8 /100 | #74 | Exceptional 10.5% |
| Sierra Leoneans | 98.7 /100 | #75 | Exceptional 10.5% |
| Immigrants | Sierra Leone | 98.7 /100 | #76 | Exceptional 10.5% |
| Laotians | 98.6 /100 | #77 | Exceptional 10.6% |
| Immigrants | Russia | 98.6 /100 | #78 | Exceptional 10.6% |
| Zimbabweans | 98.4 /100 | #79 | Exceptional 10.6% |
| Immigrants | Jordan | 98.4 /100 | #80 | Exceptional 10.6% |
| Immigrants | Chile | 98.3 /100 | #81 | Exceptional 10.6% |
| Immigrants | Guyana | 98.2 /100 | #82 | Exceptional 10.6% |
| Immigrants | Poland | 98.1 /100 | #83 | Exceptional 10.6% |
| Bulgarians | 98.1 /100 | #84 | Exceptional 10.6% |
| Sri Lankans | 97.9 /100 | #85 | Exceptional 10.6% |
| Immigrants | Ireland | 97.9 /100 | #86 | Exceptional 10.6% |
| Immigrants | Vietnam | 97.9 /100 | #87 | Exceptional 10.6% |
| Immigrants | Western Asia | 97.8 /100 | #88 | Exceptional 10.6% |
| Immigrants | Nicaragua | 97.8 /100 | #89 | Exceptional 10.6% |
| Immigrants | Morocco | 97.7 /100 | #90 | Exceptional 10.6% |
| Immigrants | France | 97.6 /100 | #91 | Exceptional 10.6% |
| Palestinians | 97.4 /100 | #92 | Exceptional 10.7% |
| Immigrants | St. Vincent and the Grenadines | 97.1 /100 | #93 | Exceptional 10.7% |
| Immigrants | Sweden | 96.9 /100 | #94 | Exceptional 10.7% |