Immigrants from Sweden vs Seminole Male Disability
COMPARE
Immigrants from Sweden
Seminole
Male Disability
Male Disability Comparison
Immigrants from Sweden
Seminole
10.7%
MALE DISABILITY
96.9/ 100
METRIC RATING
94th/ 347
METRIC RANK
14.7%
MALE DISABILITY
0.0/ 100
METRIC RATING
332nd/ 347
METRIC RANK
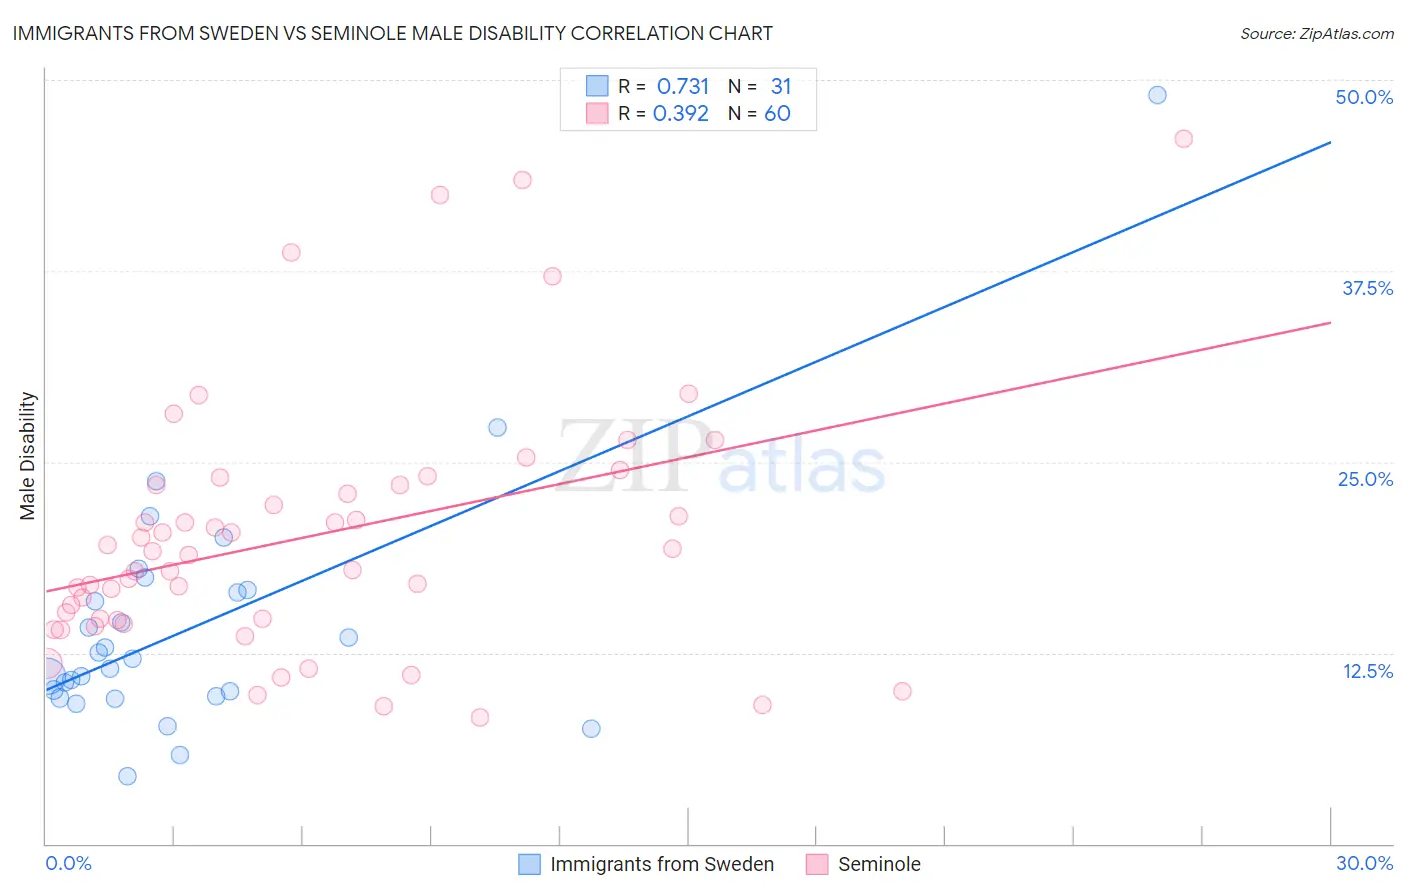
Immigrants from Sweden vs Seminole Male Disability Correlation Chart
The statistical analysis conducted on geographies consisting of 164,748,272 people shows a strong positive correlation between the proportion of Immigrants from Sweden and percentage of males with a disability in the United States with a correlation coefficient (R) of 0.731 and weighted average of 10.7%. Similarly, the statistical analysis conducted on geographies consisting of 118,308,545 people shows a mild positive correlation between the proportion of Seminole and percentage of males with a disability in the United States with a correlation coefficient (R) of 0.392 and weighted average of 14.7%, a difference of 37.8%.
Male Disability Correlation Summary
| Measurement | Immigrants from Sweden | Seminole |
| Minimum | 4.4% | 8.3% |
| Maximum | 49.0% | 46.2% |
| Range | 44.6% | 37.9% |
| Mean | 14.3% | 20.2% |
| Median | 12.1% | 19.0% |
| Interquartile 25% (IQ1) | 9.7% | 14.7% |
| Interquartile 75% (IQ3) | 16.6% | 23.5% |
| Interquartile Range (IQR) | 6.9% | 8.8% |
| Standard Deviation (Sample) | 8.2% | 8.4% |
| Standard Deviation (Population) | 8.1% | 8.3% |
Similar Demographics by Male Disability
Demographics Similar to Immigrants from Sweden by Male Disability
In terms of male disability, the demographic groups most similar to Immigrants from Sweden are Chilean (10.7%, a difference of 0.030%), Immigrants from St. Vincent and the Grenadines (10.7%, a difference of 0.11%), Nicaraguan (10.7%, a difference of 0.13%), Immigrants from Armenia (10.7%, a difference of 0.15%), and Immigrants from Romania (10.7%, a difference of 0.21%).
| Demographics | Rating | Rank | Male Disability |
| Immigrants | Vietnam | 97.9 /100 | #87 | Exceptional 10.6% |
| Immigrants | Western Asia | 97.8 /100 | #88 | Exceptional 10.6% |
| Immigrants | Nicaragua | 97.8 /100 | #89 | Exceptional 10.6% |
| Immigrants | Morocco | 97.7 /100 | #90 | Exceptional 10.6% |
| Immigrants | France | 97.6 /100 | #91 | Exceptional 10.6% |
| Palestinians | 97.4 /100 | #92 | Exceptional 10.7% |
| Immigrants | St. Vincent and the Grenadines | 97.1 /100 | #93 | Exceptional 10.7% |
| Immigrants | Sweden | 96.9 /100 | #94 | Exceptional 10.7% |
| Chileans | 96.9 /100 | #95 | Exceptional 10.7% |
| Nicaraguans | 96.6 /100 | #96 | Exceptional 10.7% |
| Immigrants | Armenia | 96.6 /100 | #97 | Exceptional 10.7% |
| Immigrants | Romania | 96.5 /100 | #98 | Exceptional 10.7% |
| Immigrants | Switzerland | 96.1 /100 | #99 | Exceptional 10.7% |
| Immigrants | Kazakhstan | 95.9 /100 | #100 | Exceptional 10.7% |
| Immigrants | Greece | 95.6 /100 | #101 | Exceptional 10.7% |
Demographics Similar to Seminole by Male Disability
In terms of male disability, the demographic groups most similar to Seminole are Yuman (14.7%, a difference of 0.10%), Tohono O'odham (14.6%, a difference of 0.78%), Cherokee (14.8%, a difference of 0.78%), Dutch West Indian (14.8%, a difference of 0.80%), and Alaskan Athabascan (14.9%, a difference of 1.3%).
| Demographics | Rating | Rank | Male Disability |
| Ottawa | 0.0 /100 | #325 | Tragic 14.1% |
| Natives/Alaskans | 0.0 /100 | #326 | Tragic 14.2% |
| Potawatomi | 0.0 /100 | #327 | Tragic 14.2% |
| Chippewa | 0.0 /100 | #328 | Tragic 14.3% |
| Cajuns | 0.0 /100 | #329 | Tragic 14.4% |
| Navajo | 0.0 /100 | #330 | Tragic 14.4% |
| Tohono O'odham | 0.0 /100 | #331 | Tragic 14.6% |
| Seminole | 0.0 /100 | #332 | Tragic 14.7% |
| Yuman | 0.0 /100 | #333 | Tragic 14.7% |
| Cherokee | 0.0 /100 | #334 | Tragic 14.8% |
| Dutch West Indians | 0.0 /100 | #335 | Tragic 14.8% |
| Alaskan Athabascans | 0.0 /100 | #336 | Tragic 14.9% |
| Menominee | 0.0 /100 | #337 | Tragic 15.0% |
| Pueblo | 0.0 /100 | #338 | Tragic 15.0% |
| Chickasaw | 0.0 /100 | #339 | Tragic 15.1% |