Immigrants from Sweden vs Immigrants from Vietnam Male Disability
COMPARE
Immigrants from Sweden
Immigrants from Vietnam
Male Disability
Male Disability Comparison
Immigrants from Sweden
Immigrants from Vietnam
10.7%
MALE DISABILITY
96.9/ 100
METRIC RATING
94th/ 347
METRIC RANK
10.6%
MALE DISABILITY
97.9/ 100
METRIC RATING
87th/ 347
METRIC RANK
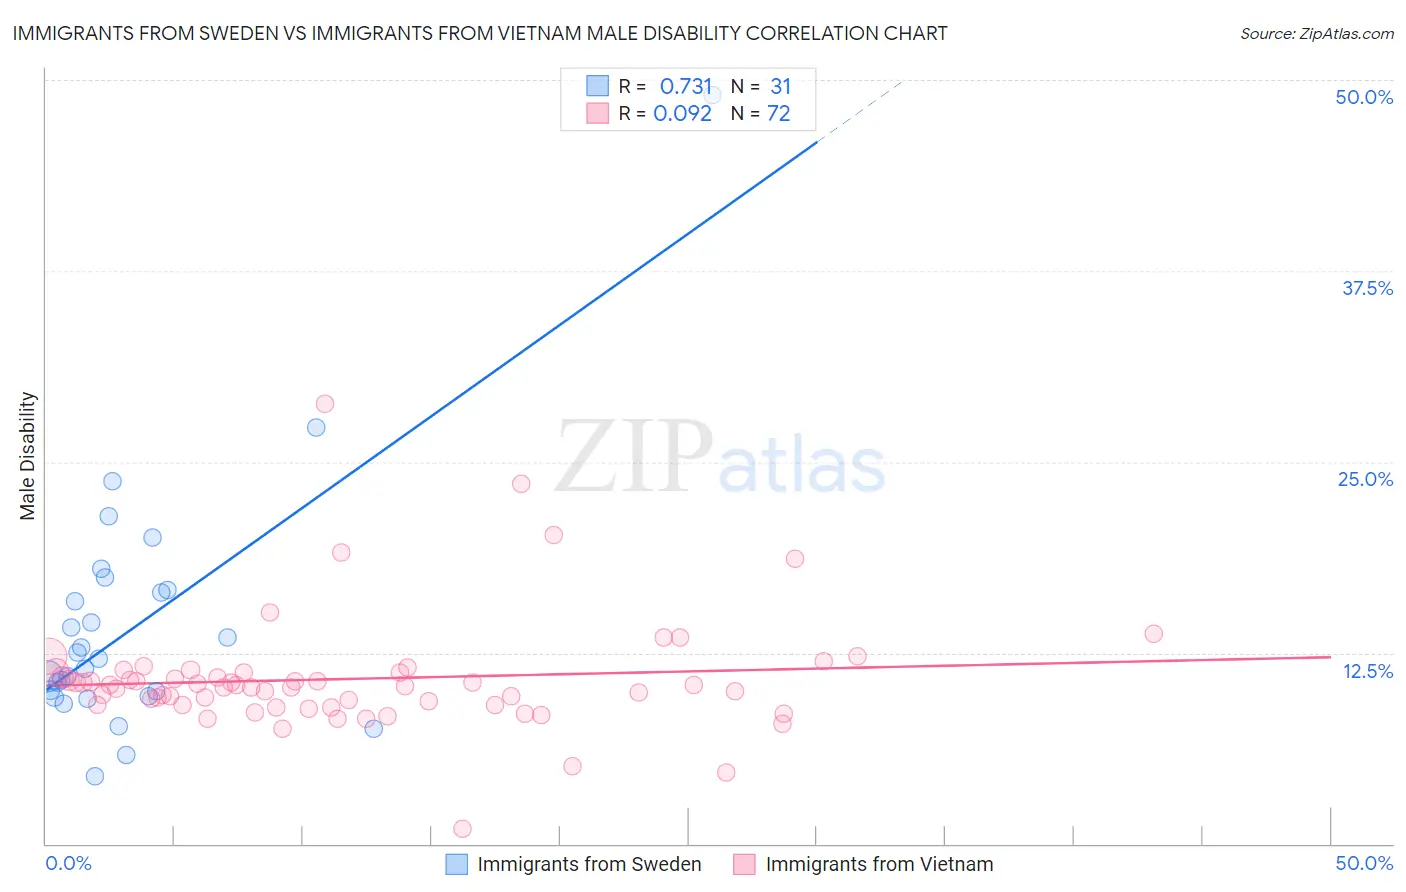
Immigrants from Sweden vs Immigrants from Vietnam Male Disability Correlation Chart
The statistical analysis conducted on geographies consisting of 164,748,272 people shows a strong positive correlation between the proportion of Immigrants from Sweden and percentage of males with a disability in the United States with a correlation coefficient (R) of 0.731 and weighted average of 10.7%. Similarly, the statistical analysis conducted on geographies consisting of 404,767,194 people shows a slight positive correlation between the proportion of Immigrants from Vietnam and percentage of males with a disability in the United States with a correlation coefficient (R) of 0.092 and weighted average of 10.6%, a difference of 0.55%.
Male Disability Correlation Summary
| Measurement | Immigrants from Sweden | Immigrants from Vietnam |
| Minimum | 4.4% | 0.96% |
| Maximum | 49.0% | 28.8% |
| Range | 44.6% | 27.9% |
| Mean | 14.3% | 10.8% |
| Median | 12.1% | 10.3% |
| Interquartile 25% (IQ1) | 9.7% | 9.1% |
| Interquartile 75% (IQ3) | 16.6% | 11.2% |
| Interquartile Range (IQR) | 6.9% | 2.1% |
| Standard Deviation (Sample) | 8.2% | 3.8% |
| Standard Deviation (Population) | 8.1% | 3.8% |
Demographics Similar to Immigrants from Sweden and Immigrants from Vietnam by Male Disability
In terms of male disability, the demographic groups most similar to Immigrants from Sweden are Chilean (10.7%, a difference of 0.030%), Immigrants from St. Vincent and the Grenadines (10.7%, a difference of 0.11%), Nicaraguan (10.7%, a difference of 0.13%), Immigrants from Armenia (10.7%, a difference of 0.15%), and Immigrants from Romania (10.7%, a difference of 0.21%). Similarly, the demographic groups most similar to Immigrants from Vietnam are Immigrants from Ireland (10.6%, a difference of 0.020%), Sri Lankan (10.6%, a difference of 0.030%), Immigrants from Western Asia (10.6%, a difference of 0.070%), Immigrants from Nicaragua (10.6%, a difference of 0.070%), and Immigrants from Morocco (10.6%, a difference of 0.12%).
| Demographics | Rating | Rank | Male Disability |
| Immigrants | Jordan | 98.4 /100 | #80 | Exceptional 10.6% |
| Immigrants | Chile | 98.3 /100 | #81 | Exceptional 10.6% |
| Immigrants | Guyana | 98.2 /100 | #82 | Exceptional 10.6% |
| Immigrants | Poland | 98.1 /100 | #83 | Exceptional 10.6% |
| Bulgarians | 98.1 /100 | #84 | Exceptional 10.6% |
| Sri Lankans | 97.9 /100 | #85 | Exceptional 10.6% |
| Immigrants | Ireland | 97.9 /100 | #86 | Exceptional 10.6% |
| Immigrants | Vietnam | 97.9 /100 | #87 | Exceptional 10.6% |
| Immigrants | Western Asia | 97.8 /100 | #88 | Exceptional 10.6% |
| Immigrants | Nicaragua | 97.8 /100 | #89 | Exceptional 10.6% |
| Immigrants | Morocco | 97.7 /100 | #90 | Exceptional 10.6% |
| Immigrants | France | 97.6 /100 | #91 | Exceptional 10.6% |
| Palestinians | 97.4 /100 | #92 | Exceptional 10.7% |
| Immigrants | St. Vincent and the Grenadines | 97.1 /100 | #93 | Exceptional 10.7% |
| Immigrants | Sweden | 96.9 /100 | #94 | Exceptional 10.7% |
| Chileans | 96.9 /100 | #95 | Exceptional 10.7% |
| Nicaraguans | 96.6 /100 | #96 | Exceptional 10.7% |
| Immigrants | Armenia | 96.6 /100 | #97 | Exceptional 10.7% |
| Immigrants | Romania | 96.5 /100 | #98 | Exceptional 10.7% |
| Immigrants | Switzerland | 96.1 /100 | #99 | Exceptional 10.7% |
| Immigrants | Kazakhstan | 95.9 /100 | #100 | Exceptional 10.7% |