Immigrants from Sweden vs Immigrants from Morocco Disability
COMPARE
Immigrants from Sweden
Immigrants from Morocco
Disability
Disability Comparison
Immigrants from Sweden
Immigrants from Morocco
11.0%
DISABILITY
99.6/ 100
METRIC RATING
64th/ 347
METRIC RANK
11.2%
DISABILITY
97.8/ 100
METRIC RATING
94th/ 347
METRIC RANK
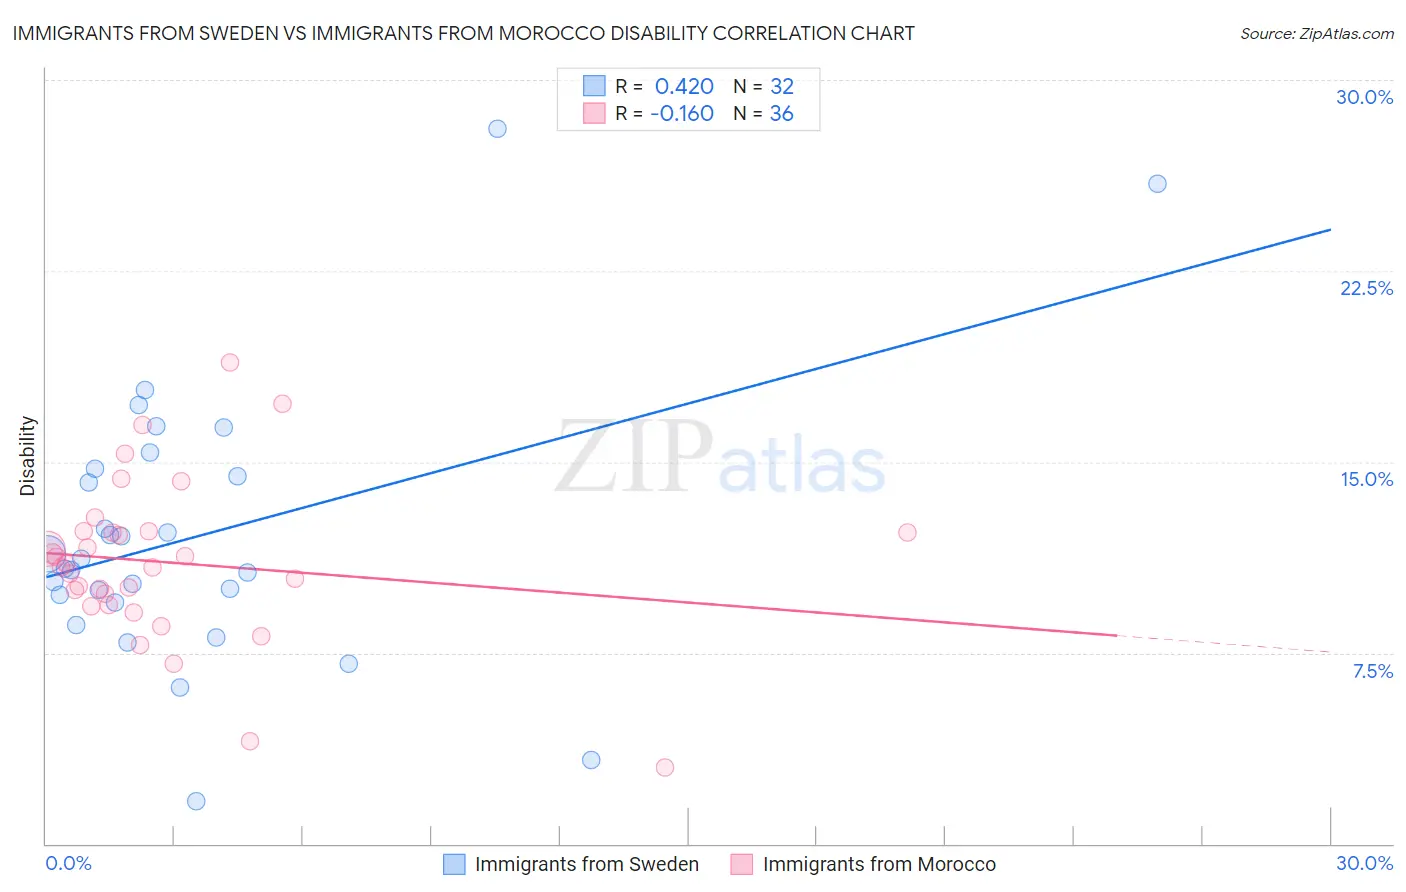
Immigrants from Sweden vs Immigrants from Morocco Disability Correlation Chart
The statistical analysis conducted on geographies consisting of 164,749,028 people shows a moderate positive correlation between the proportion of Immigrants from Sweden and percentage of population with a disability in the United States with a correlation coefficient (R) of 0.420 and weighted average of 11.0%. Similarly, the statistical analysis conducted on geographies consisting of 178,910,463 people shows a poor negative correlation between the proportion of Immigrants from Morocco and percentage of population with a disability in the United States with a correlation coefficient (R) of -0.160 and weighted average of 11.2%, a difference of 2.2%.
Disability Correlation Summary
| Measurement | Immigrants from Sweden | Immigrants from Morocco |
| Minimum | 1.7% | 3.0% |
| Maximum | 28.1% | 18.9% |
| Range | 26.4% | 15.9% |
| Mean | 12.1% | 11.0% |
| Median | 11.0% | 10.9% |
| Interquartile 25% (IQ1) | 9.6% | 9.6% |
| Interquartile 75% (IQ3) | 14.6% | 12.2% |
| Interquartile Range (IQR) | 4.9% | 2.7% |
| Standard Deviation (Sample) | 5.4% | 3.2% |
| Standard Deviation (Population) | 5.3% | 3.1% |
Similar Demographics by Disability
Demographics Similar to Immigrants from Sweden by Disability
In terms of disability, the demographic groups most similar to Immigrants from Sweden are Bulgarian (11.0%, a difference of 0.020%), Laotian (11.0%, a difference of 0.030%), Colombian (11.0%, a difference of 0.11%), Immigrants from Eritrea (11.0%, a difference of 0.18%), and Immigrants from Northern Africa (10.9%, a difference of 0.20%).
| Demographics | Rating | Rank | Disability |
| Salvadorans | 99.8 /100 | #57 | Exceptional 10.9% |
| Immigrants | South America | 99.8 /100 | #58 | Exceptional 10.9% |
| Immigrants | Colombia | 99.7 /100 | #59 | Exceptional 10.9% |
| Zimbabweans | 99.7 /100 | #60 | Exceptional 10.9% |
| Immigrants | Bulgaria | 99.7 /100 | #61 | Exceptional 10.9% |
| Immigrants | Northern Africa | 99.7 /100 | #62 | Exceptional 10.9% |
| Immigrants | Eritrea | 99.7 /100 | #63 | Exceptional 11.0% |
| Immigrants | Sweden | 99.6 /100 | #64 | Exceptional 11.0% |
| Bulgarians | 99.6 /100 | #65 | Exceptional 11.0% |
| Laotians | 99.6 /100 | #66 | Exceptional 11.0% |
| Colombians | 99.6 /100 | #67 | Exceptional 11.0% |
| Immigrants | Afghanistan | 99.6 /100 | #68 | Exceptional 11.0% |
| Sri Lankans | 99.5 /100 | #69 | Exceptional 11.0% |
| Immigrants | France | 99.4 /100 | #70 | Exceptional 11.0% |
| Immigrants | Lebanon | 99.4 /100 | #71 | Exceptional 11.0% |
Demographics Similar to Immigrants from Morocco by Disability
In terms of disability, the demographic groups most similar to Immigrants from Morocco are Eastern European (11.2%, a difference of 0.010%), Immigrants from Zimbabwe (11.2%, a difference of 0.070%), Ecuadorian (11.2%, a difference of 0.12%), Immigrants from Ecuador (11.2%, a difference of 0.12%), and Immigrants from Western Asia (11.2%, a difference of 0.16%).
| Demographics | Rating | Rank | Disability |
| Palestinians | 98.9 /100 | #87 | Exceptional 11.1% |
| Immigrants | Romania | 98.5 /100 | #88 | Exceptional 11.2% |
| Immigrants | South Africa | 98.2 /100 | #89 | Exceptional 11.2% |
| Immigrants | Brazil | 98.1 /100 | #90 | Exceptional 11.2% |
| Immigrants | Western Asia | 98.1 /100 | #91 | Exceptional 11.2% |
| Ecuadorians | 98.0 /100 | #92 | Exceptional 11.2% |
| Immigrants | Ecuador | 98.0 /100 | #93 | Exceptional 11.2% |
| Immigrants | Morocco | 97.8 /100 | #94 | Exceptional 11.2% |
| Eastern Europeans | 97.8 /100 | #95 | Exceptional 11.2% |
| Immigrants | Zimbabwe | 97.7 /100 | #96 | Exceptional 11.2% |
| Bhutanese | 97.4 /100 | #97 | Exceptional 11.2% |
| Uruguayans | 97.4 /100 | #98 | Exceptional 11.2% |
| Immigrants | Czechoslovakia | 97.4 /100 | #99 | Exceptional 11.2% |
| Immigrants | Greece | 96.9 /100 | #100 | Exceptional 11.3% |
| Immigrants | Nicaragua | 96.8 /100 | #101 | Exceptional 11.3% |