Immigrants from Sweden vs Serbian Disability
COMPARE
Immigrants from Sweden
Serbian
Disability
Disability Comparison
Immigrants from Sweden
Serbians
11.0%
DISABILITY
99.6/ 100
METRIC RATING
64th/ 347
METRIC RANK
11.9%
DISABILITY
15.4/ 100
METRIC RATING
196th/ 347
METRIC RANK
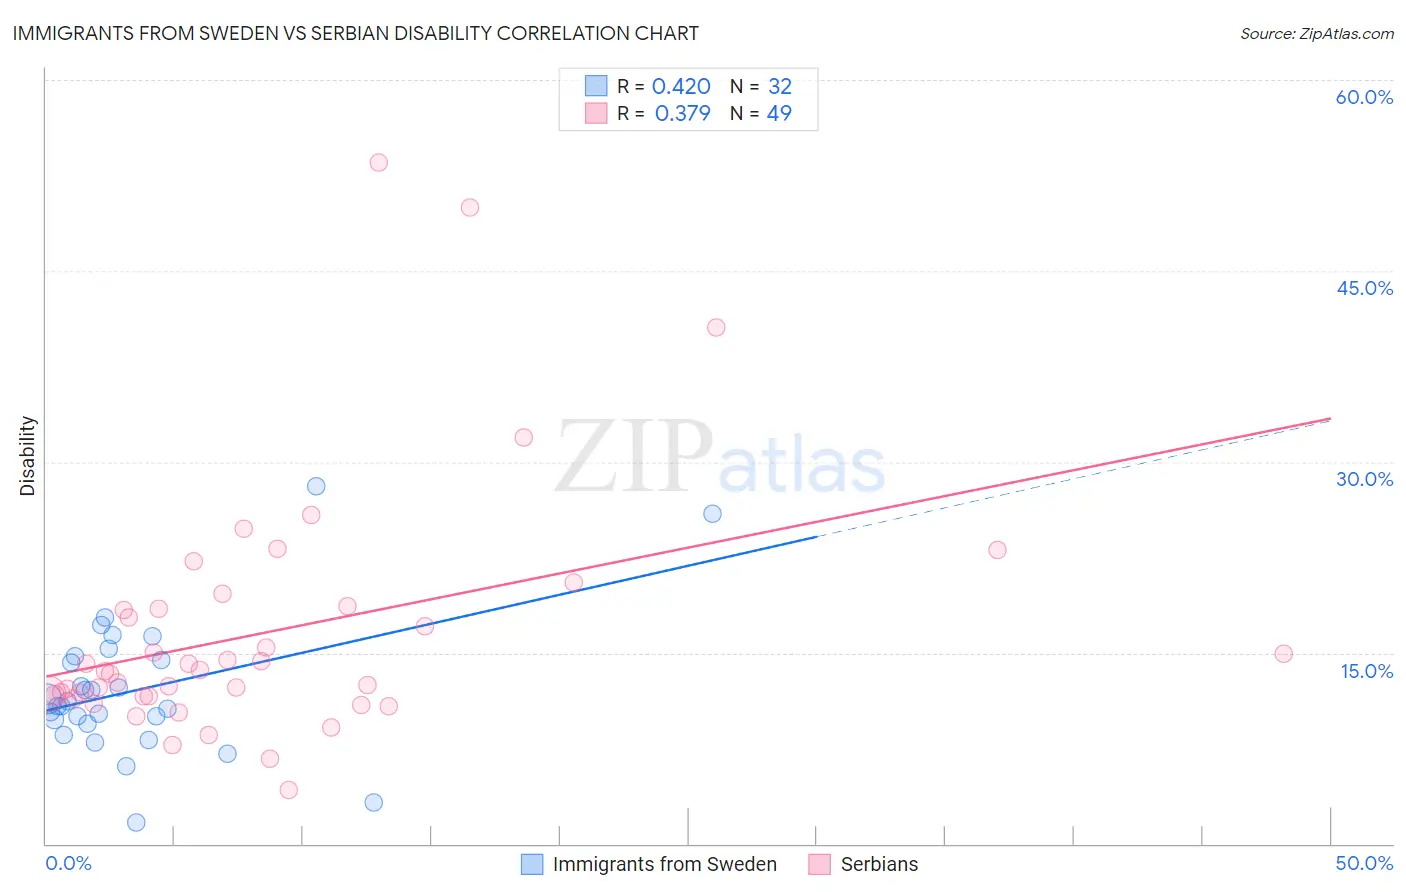
Immigrants from Sweden vs Serbian Disability Correlation Chart
The statistical analysis conducted on geographies consisting of 164,749,028 people shows a moderate positive correlation between the proportion of Immigrants from Sweden and percentage of population with a disability in the United States with a correlation coefficient (R) of 0.420 and weighted average of 11.0%. Similarly, the statistical analysis conducted on geographies consisting of 267,644,318 people shows a mild positive correlation between the proportion of Serbians and percentage of population with a disability in the United States with a correlation coefficient (R) of 0.379 and weighted average of 11.9%, a difference of 8.7%.
Disability Correlation Summary
| Measurement | Immigrants from Sweden | Serbian |
| Minimum | 1.7% | 4.2% |
| Maximum | 28.1% | 53.5% |
| Range | 26.4% | 49.3% |
| Mean | 12.1% | 16.6% |
| Median | 11.0% | 13.6% |
| Interquartile 25% (IQ1) | 9.6% | 11.6% |
| Interquartile 75% (IQ3) | 14.6% | 18.6% |
| Interquartile Range (IQR) | 4.9% | 7.0% |
| Standard Deviation (Sample) | 5.4% | 9.7% |
| Standard Deviation (Population) | 5.3% | 9.6% |
Similar Demographics by Disability
Demographics Similar to Immigrants from Sweden by Disability
In terms of disability, the demographic groups most similar to Immigrants from Sweden are Bulgarian (11.0%, a difference of 0.020%), Laotian (11.0%, a difference of 0.030%), Colombian (11.0%, a difference of 0.11%), Immigrants from Eritrea (11.0%, a difference of 0.18%), and Immigrants from Northern Africa (10.9%, a difference of 0.20%).
| Demographics | Rating | Rank | Disability |
| Salvadorans | 99.8 /100 | #57 | Exceptional 10.9% |
| Immigrants | South America | 99.8 /100 | #58 | Exceptional 10.9% |
| Immigrants | Colombia | 99.7 /100 | #59 | Exceptional 10.9% |
| Zimbabweans | 99.7 /100 | #60 | Exceptional 10.9% |
| Immigrants | Bulgaria | 99.7 /100 | #61 | Exceptional 10.9% |
| Immigrants | Northern Africa | 99.7 /100 | #62 | Exceptional 10.9% |
| Immigrants | Eritrea | 99.7 /100 | #63 | Exceptional 11.0% |
| Immigrants | Sweden | 99.6 /100 | #64 | Exceptional 11.0% |
| Bulgarians | 99.6 /100 | #65 | Exceptional 11.0% |
| Laotians | 99.6 /100 | #66 | Exceptional 11.0% |
| Colombians | 99.6 /100 | #67 | Exceptional 11.0% |
| Immigrants | Afghanistan | 99.6 /100 | #68 | Exceptional 11.0% |
| Sri Lankans | 99.5 /100 | #69 | Exceptional 11.0% |
| Immigrants | France | 99.4 /100 | #70 | Exceptional 11.0% |
| Immigrants | Lebanon | 99.4 /100 | #71 | Exceptional 11.0% |
Demographics Similar to Serbians by Disability
In terms of disability, the demographic groups most similar to Serbians are Immigrants from Belize (11.9%, a difference of 0.010%), Barbadian (11.9%, a difference of 0.040%), Ukrainian (11.9%, a difference of 0.060%), Immigrants from Panama (11.9%, a difference of 0.070%), and Somali (11.9%, a difference of 0.15%).
| Demographics | Rating | Rank | Disability |
| Immigrants | Zaire | 21.8 /100 | #189 | Fair 11.9% |
| Immigrants | West Indies | 21.1 /100 | #190 | Fair 11.9% |
| Ute | 19.5 /100 | #191 | Poor 11.9% |
| Lithuanians | 18.8 /100 | #192 | Poor 11.9% |
| Immigrants | Bosnia and Herzegovina | 18.0 /100 | #193 | Poor 11.9% |
| Somalis | 17.3 /100 | #194 | Poor 11.9% |
| Barbadians | 15.8 /100 | #195 | Poor 11.9% |
| Serbians | 15.4 /100 | #196 | Poor 11.9% |
| Immigrants | Belize | 15.2 /100 | #197 | Poor 11.9% |
| Ukrainians | 14.7 /100 | #198 | Poor 11.9% |
| Immigrants | Panama | 14.6 /100 | #199 | Poor 11.9% |
| Belizeans | 12.8 /100 | #200 | Poor 11.9% |
| Assyrians/Chaldeans/Syriacs | 12.6 /100 | #201 | Poor 11.9% |
| Immigrants | England | 12.0 /100 | #202 | Poor 12.0% |
| British West Indians | 11.5 /100 | #203 | Poor 12.0% |