Immigrants from Morocco vs Immigrants from Cambodia Disability Age Under 5
COMPARE
Immigrants from Morocco
Immigrants from Cambodia
Disability Age Under 5
Disability Age Under 5 Comparison
Immigrants from Morocco
Immigrants from Cambodia
1.2%
DISABILITY AGE UNDER 5
96.0/ 100
METRIC RATING
102nd/ 347
METRIC RANK
1.2%
DISABILITY AGE UNDER 5
90.5/ 100
METRIC RATING
124th/ 347
METRIC RANK
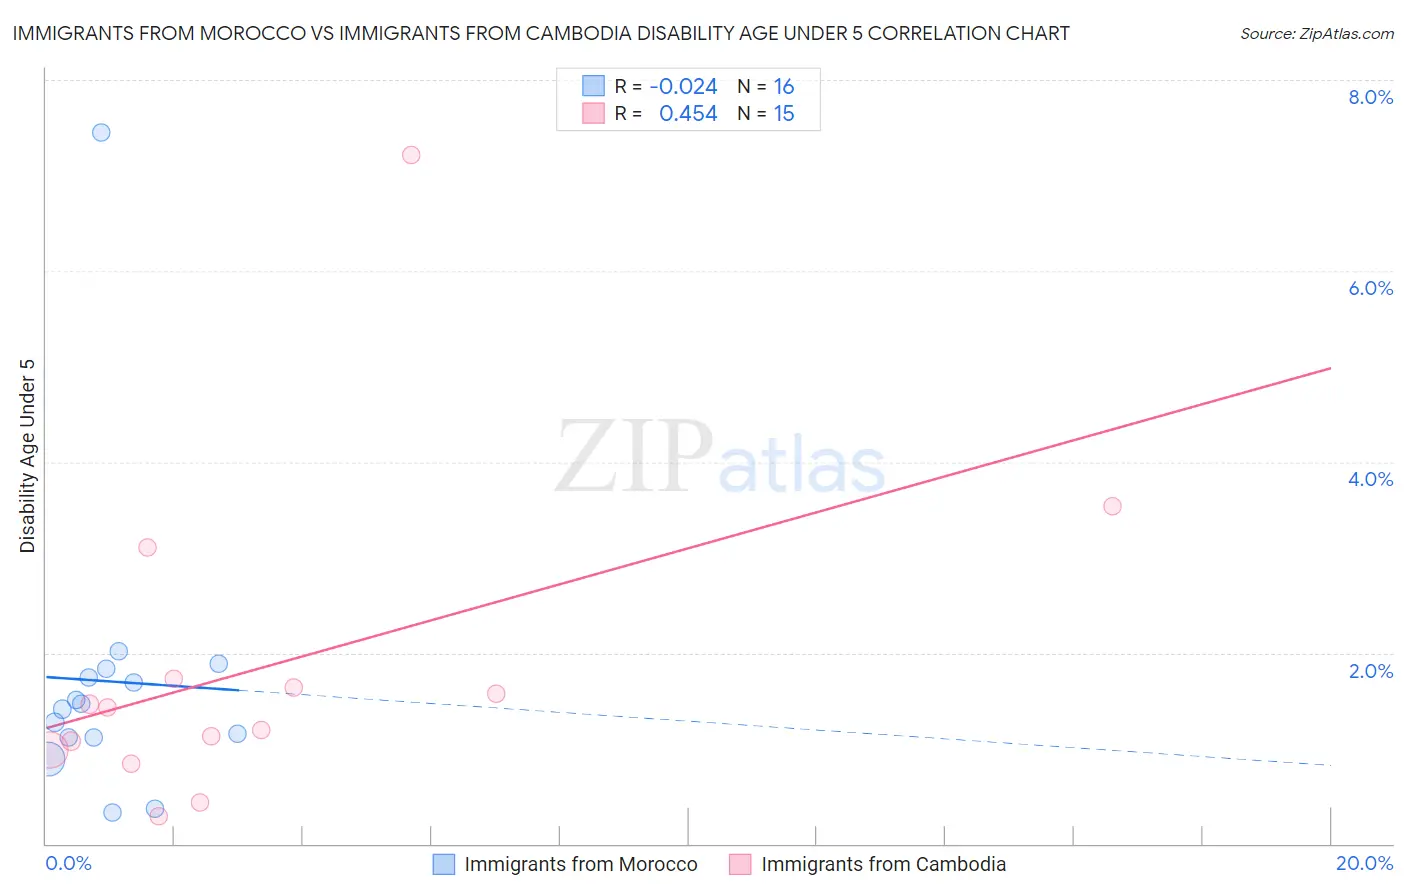
Immigrants from Morocco vs Immigrants from Cambodia Disability Age Under 5 Correlation Chart
The statistical analysis conducted on geographies consisting of 120,271,602 people shows no correlation between the proportion of Immigrants from Morocco and percentage of population with a disability under the age of 5 in the United States with a correlation coefficient (R) of -0.024 and weighted average of 1.2%. Similarly, the statistical analysis conducted on geographies consisting of 138,793,023 people shows a moderate positive correlation between the proportion of Immigrants from Cambodia and percentage of population with a disability under the age of 5 in the United States with a correlation coefficient (R) of 0.454 and weighted average of 1.2%, a difference of 2.3%.
Disability Age Under 5 Correlation Summary
| Measurement | Immigrants from Morocco | Immigrants from Cambodia |
| Minimum | 0.32% | 0.29% |
| Maximum | 7.4% | 7.2% |
| Range | 7.1% | 6.9% |
| Mean | 1.7% | 1.8% |
| Median | 1.4% | 1.4% |
| Interquartile 25% (IQ1) | 1.1% | 0.98% |
| Interquartile 75% (IQ3) | 1.8% | 1.7% |
| Interquartile Range (IQR) | 0.68% | 0.75% |
| Standard Deviation (Sample) | 1.6% | 1.7% |
| Standard Deviation (Population) | 1.6% | 1.7% |
Similar Demographics by Disability Age Under 5
Demographics Similar to Immigrants from Morocco by Disability Age Under 5
In terms of disability age under 5, the demographic groups most similar to Immigrants from Morocco are Immigrants from Nicaragua (1.2%, a difference of 0.0%), Immigrants from Uganda (1.1%, a difference of 0.060%), Indonesian (1.2%, a difference of 0.070%), Nicaraguan (1.1%, a difference of 0.17%), and Dominican (1.1%, a difference of 0.20%).
| Demographics | Rating | Rank | Disability Age Under 5 |
| Immigrants | Moldova | 96.8 /100 | #95 | Exceptional 1.1% |
| Mongolians | 96.6 /100 | #96 | Exceptional 1.1% |
| Immigrants | Iraq | 96.5 /100 | #97 | Exceptional 1.1% |
| Immigrants | South Eastern Asia | 96.5 /100 | #98 | Exceptional 1.1% |
| Dominicans | 96.3 /100 | #99 | Exceptional 1.1% |
| Nicaraguans | 96.3 /100 | #100 | Exceptional 1.1% |
| Immigrants | Uganda | 96.1 /100 | #101 | Exceptional 1.1% |
| Immigrants | Morocco | 96.0 /100 | #102 | Exceptional 1.2% |
| Immigrants | Nicaragua | 96.0 /100 | #103 | Exceptional 1.2% |
| Indonesians | 95.9 /100 | #104 | Exceptional 1.2% |
| Immigrants | South Africa | 95.6 /100 | #105 | Exceptional 1.2% |
| Cambodians | 95.4 /100 | #106 | Exceptional 1.2% |
| Immigrants | West Indies | 95.3 /100 | #107 | Exceptional 1.2% |
| Iraqis | 95.1 /100 | #108 | Exceptional 1.2% |
| Immigrants | Panama | 95.0 /100 | #109 | Exceptional 1.2% |
Demographics Similar to Immigrants from Cambodia by Disability Age Under 5
In terms of disability age under 5, the demographic groups most similar to Immigrants from Cambodia are Zimbabwean (1.2%, a difference of 0.020%), Japanese (1.2%, a difference of 0.060%), Aleut (1.2%, a difference of 0.070%), Central American (1.2%, a difference of 0.22%), and Immigrants from Senegal (1.2%, a difference of 0.26%).
| Demographics | Rating | Rank | Disability Age Under 5 |
| Immigrants | Philippines | 93.5 /100 | #117 | Exceptional 1.2% |
| Immigrants | Venezuela | 93.4 /100 | #118 | Exceptional 1.2% |
| Bhutanese | 92.5 /100 | #119 | Exceptional 1.2% |
| Immigrants | Eritrea | 92.3 /100 | #120 | Exceptional 1.2% |
| Immigrants | Senegal | 91.4 /100 | #121 | Exceptional 1.2% |
| Aleuts | 90.7 /100 | #122 | Exceptional 1.2% |
| Zimbabweans | 90.6 /100 | #123 | Exceptional 1.2% |
| Immigrants | Cambodia | 90.5 /100 | #124 | Exceptional 1.2% |
| Japanese | 90.3 /100 | #125 | Exceptional 1.2% |
| Central Americans | 89.7 /100 | #126 | Excellent 1.2% |
| Immigrants | Romania | 88.4 /100 | #127 | Excellent 1.2% |
| Immigrants | France | 88.4 /100 | #128 | Excellent 1.2% |
| Immigrants | Immigrants | 88.0 /100 | #129 | Excellent 1.2% |
| Koreans | 87.7 /100 | #130 | Excellent 1.2% |
| Immigrants | Serbia | 87.6 /100 | #131 | Excellent 1.2% |