Immigrants from Sri Lanka vs Swedish Ambulatory Disability
COMPARE
Immigrants from Sri Lanka
Swedish
Ambulatory Disability
Ambulatory Disability Comparison
Immigrants from Sri Lanka
Swedes
5.4%
AMBULATORY DISABILITY
100.0/ 100
METRIC RATING
18th/ 347
METRIC RANK
6.0%
AMBULATORY DISABILITY
83.1/ 100
METRIC RATING
141st/ 347
METRIC RANK
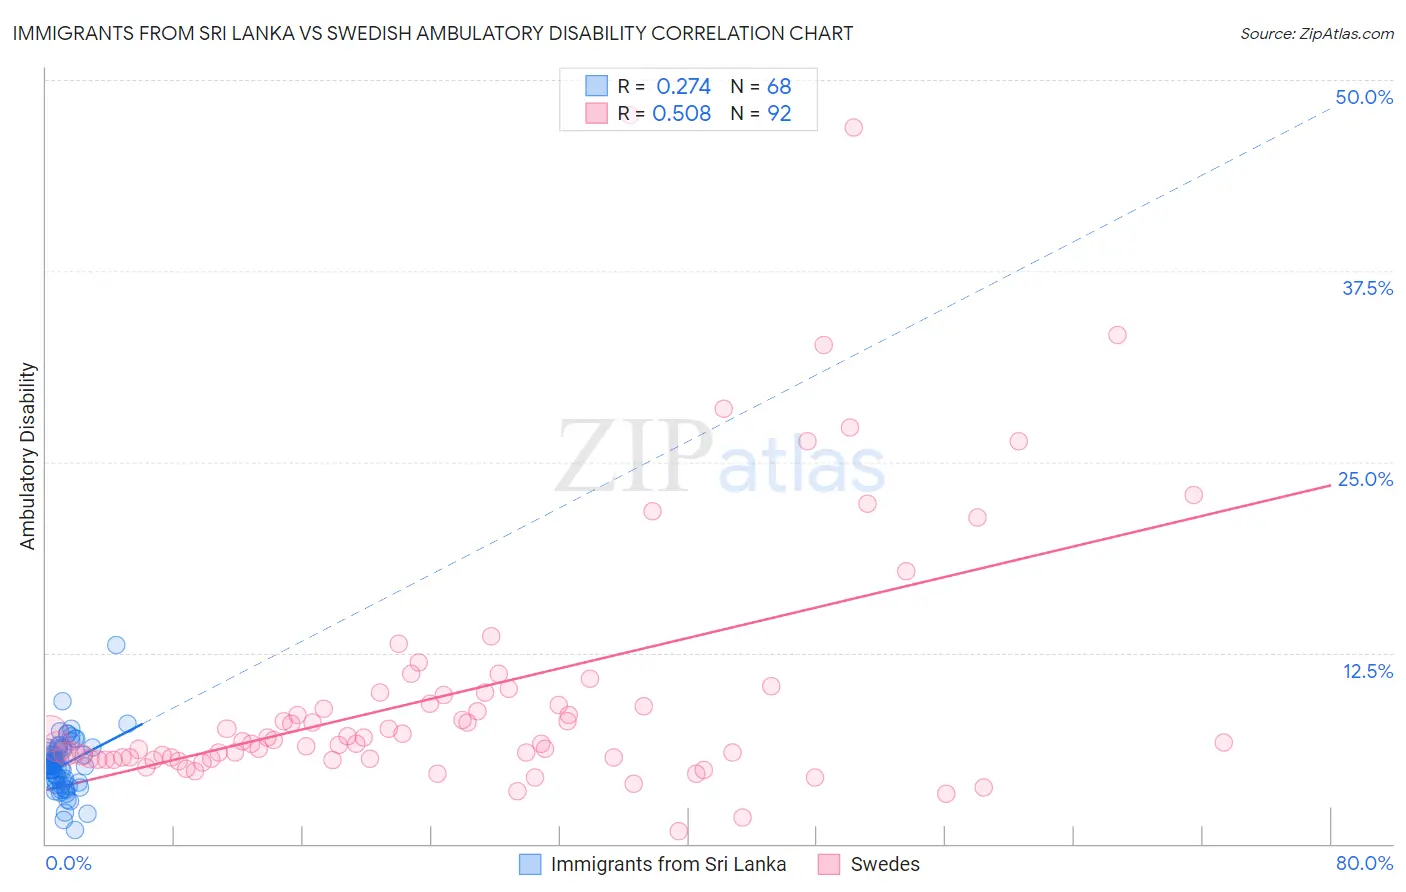
Immigrants from Sri Lanka vs Swedish Ambulatory Disability Correlation Chart
The statistical analysis conducted on geographies consisting of 149,694,852 people shows a weak positive correlation between the proportion of Immigrants from Sri Lanka and percentage of population with ambulatory disability in the United States with a correlation coefficient (R) of 0.274 and weighted average of 5.4%. Similarly, the statistical analysis conducted on geographies consisting of 538,852,545 people shows a substantial positive correlation between the proportion of Swedes and percentage of population with ambulatory disability in the United States with a correlation coefficient (R) of 0.508 and weighted average of 6.0%, a difference of 11.8%.
Ambulatory Disability Correlation Summary
| Measurement | Immigrants from Sri Lanka | Swedish |
| Minimum | 0.94% | 0.84% |
| Maximum | 13.0% | 47.7% |
| Range | 12.1% | 46.9% |
| Mean | 5.2% | 9.9% |
| Median | 5.1% | 6.7% |
| Interquartile 25% (IQ1) | 4.1% | 5.6% |
| Interquartile 75% (IQ3) | 6.2% | 9.8% |
| Interquartile Range (IQR) | 2.1% | 4.3% |
| Standard Deviation (Sample) | 1.8% | 8.7% |
| Standard Deviation (Population) | 1.8% | 8.6% |
Similar Demographics by Ambulatory Disability
Demographics Similar to Immigrants from Sri Lanka by Ambulatory Disability
In terms of ambulatory disability, the demographic groups most similar to Immigrants from Sri Lanka are Immigrants from Ethiopia (5.4%, a difference of 0.010%), Indian (Asian) (5.4%, a difference of 0.10%), Ethiopian (5.4%, a difference of 0.12%), Immigrants from Kuwait (5.4%, a difference of 0.13%), and Immigrants from Hong Kong (5.3%, a difference of 0.34%).
| Demographics | Rating | Rank | Ambulatory Disability |
| Immigrants | Korea | 100.0 /100 | #11 | Exceptional 5.2% |
| Okinawans | 100.0 /100 | #12 | Exceptional 5.3% |
| Burmese | 100.0 /100 | #13 | Exceptional 5.3% |
| Immigrants | Eastern Asia | 100.0 /100 | #14 | Exceptional 5.3% |
| Immigrants | China | 100.0 /100 | #15 | Exceptional 5.3% |
| Immigrants | Hong Kong | 100.0 /100 | #16 | Exceptional 5.3% |
| Immigrants | Ethiopia | 100.0 /100 | #17 | Exceptional 5.4% |
| Immigrants | Sri Lanka | 100.0 /100 | #18 | Exceptional 5.4% |
| Indians (Asian) | 100.0 /100 | #19 | Exceptional 5.4% |
| Ethiopians | 100.0 /100 | #20 | Exceptional 5.4% |
| Immigrants | Kuwait | 100.0 /100 | #21 | Exceptional 5.4% |
| Immigrants | Israel | 100.0 /100 | #22 | Exceptional 5.4% |
| Tongans | 100.0 /100 | #23 | Exceptional 5.4% |
| Immigrants | Saudi Arabia | 100.0 /100 | #24 | Exceptional 5.4% |
| Zimbabweans | 100.0 /100 | #25 | Exceptional 5.4% |
Demographics Similar to Swedes by Ambulatory Disability
In terms of ambulatory disability, the demographic groups most similar to Swedes are Immigrants from Philippines (6.0%, a difference of 0.010%), Czech (6.0%, a difference of 0.020%), Romanian (6.0%, a difference of 0.020%), Macedonian (6.0%, a difference of 0.030%), and Immigrants from Zaire (6.0%, a difference of 0.050%).
| Demographics | Rating | Rank | Ambulatory Disability |
| Ute | 86.6 /100 | #134 | Excellent 6.0% |
| Immigrants | Italy | 85.0 /100 | #135 | Excellent 6.0% |
| Immigrants | North Macedonia | 84.1 /100 | #136 | Excellent 6.0% |
| Immigrants | Syria | 84.1 /100 | #137 | Excellent 6.0% |
| Immigrants | Hungary | 83.9 /100 | #138 | Excellent 6.0% |
| Immigrants | Zaire | 83.6 /100 | #139 | Excellent 6.0% |
| Czechs | 83.3 /100 | #140 | Excellent 6.0% |
| Swedes | 83.1 /100 | #141 | Excellent 6.0% |
| Immigrants | Philippines | 83.0 /100 | #142 | Excellent 6.0% |
| Romanians | 82.9 /100 | #143 | Excellent 6.0% |
| Macedonians | 82.8 /100 | #144 | Excellent 6.0% |
| Pakistanis | 82.5 /100 | #145 | Excellent 6.0% |
| Immigrants | Greece | 82.5 /100 | #146 | Excellent 6.0% |
| Immigrants | Moldova | 82.4 /100 | #147 | Excellent 6.0% |
| Immigrants | Eastern Europe | 82.0 /100 | #148 | Excellent 6.0% |