Immigrants from Sri Lanka vs Blackfeet Ambulatory Disability
COMPARE
Immigrants from Sri Lanka
Blackfeet
Ambulatory Disability
Ambulatory Disability Comparison
Immigrants from Sri Lanka
Blackfeet
5.4%
AMBULATORY DISABILITY
100.0/ 100
METRIC RATING
18th/ 347
METRIC RANK
7.1%
AMBULATORY DISABILITY
0.0/ 100
METRIC RATING
314th/ 347
METRIC RANK
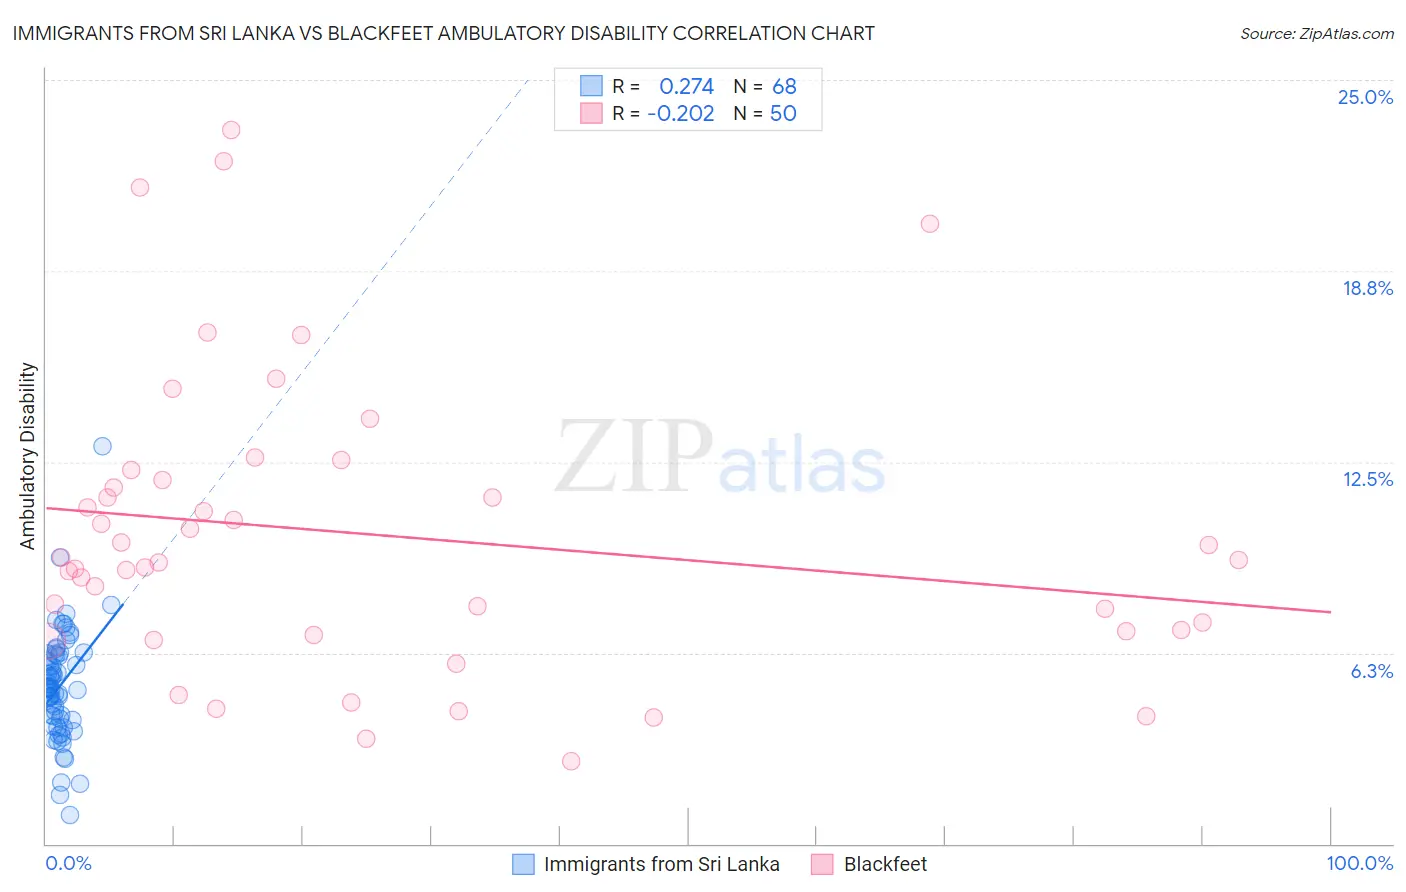
Immigrants from Sri Lanka vs Blackfeet Ambulatory Disability Correlation Chart
The statistical analysis conducted on geographies consisting of 149,694,852 people shows a weak positive correlation between the proportion of Immigrants from Sri Lanka and percentage of population with ambulatory disability in the United States with a correlation coefficient (R) of 0.274 and weighted average of 5.4%. Similarly, the statistical analysis conducted on geographies consisting of 309,475,903 people shows a weak negative correlation between the proportion of Blackfeet and percentage of population with ambulatory disability in the United States with a correlation coefficient (R) of -0.202 and weighted average of 7.1%, a difference of 33.1%.
Ambulatory Disability Correlation Summary
| Measurement | Immigrants from Sri Lanka | Blackfeet |
| Minimum | 0.94% | 2.7% |
| Maximum | 13.0% | 23.4% |
| Range | 12.1% | 20.7% |
| Mean | 5.2% | 10.1% |
| Median | 5.1% | 9.2% |
| Interquartile 25% (IQ1) | 4.1% | 6.9% |
| Interquartile 75% (IQ3) | 6.2% | 11.9% |
| Interquartile Range (IQR) | 2.1% | 5.0% |
| Standard Deviation (Sample) | 1.8% | 4.8% |
| Standard Deviation (Population) | 1.8% | 4.8% |
Similar Demographics by Ambulatory Disability
Demographics Similar to Immigrants from Sri Lanka by Ambulatory Disability
In terms of ambulatory disability, the demographic groups most similar to Immigrants from Sri Lanka are Immigrants from Ethiopia (5.4%, a difference of 0.010%), Indian (Asian) (5.4%, a difference of 0.10%), Ethiopian (5.4%, a difference of 0.12%), Immigrants from Kuwait (5.4%, a difference of 0.13%), and Immigrants from Hong Kong (5.3%, a difference of 0.34%).
| Demographics | Rating | Rank | Ambulatory Disability |
| Immigrants | Korea | 100.0 /100 | #11 | Exceptional 5.2% |
| Okinawans | 100.0 /100 | #12 | Exceptional 5.3% |
| Burmese | 100.0 /100 | #13 | Exceptional 5.3% |
| Immigrants | Eastern Asia | 100.0 /100 | #14 | Exceptional 5.3% |
| Immigrants | China | 100.0 /100 | #15 | Exceptional 5.3% |
| Immigrants | Hong Kong | 100.0 /100 | #16 | Exceptional 5.3% |
| Immigrants | Ethiopia | 100.0 /100 | #17 | Exceptional 5.4% |
| Immigrants | Sri Lanka | 100.0 /100 | #18 | Exceptional 5.4% |
| Indians (Asian) | 100.0 /100 | #19 | Exceptional 5.4% |
| Ethiopians | 100.0 /100 | #20 | Exceptional 5.4% |
| Immigrants | Kuwait | 100.0 /100 | #21 | Exceptional 5.4% |
| Immigrants | Israel | 100.0 /100 | #22 | Exceptional 5.4% |
| Tongans | 100.0 /100 | #23 | Exceptional 5.4% |
| Immigrants | Saudi Arabia | 100.0 /100 | #24 | Exceptional 5.4% |
| Zimbabweans | 100.0 /100 | #25 | Exceptional 5.4% |
Demographics Similar to Blackfeet by Ambulatory Disability
In terms of ambulatory disability, the demographic groups most similar to Blackfeet are Immigrants from Yemen (7.1%, a difference of 0.020%), Shoshone (7.1%, a difference of 0.020%), Delaware (7.1%, a difference of 0.15%), Immigrants from Dominican Republic (7.1%, a difference of 0.26%), and Central American Indian (7.2%, a difference of 0.34%).
| Demographics | Rating | Rank | Ambulatory Disability |
| Spanish Americans | 0.0 /100 | #307 | Tragic 7.1% |
| Chippewa | 0.0 /100 | #308 | Tragic 7.1% |
| Immigrants | Azores | 0.0 /100 | #309 | Tragic 7.1% |
| Arapaho | 0.0 /100 | #310 | Tragic 7.1% |
| Cree | 0.0 /100 | #311 | Tragic 7.1% |
| Delaware | 0.0 /100 | #312 | Tragic 7.1% |
| Immigrants | Yemen | 0.0 /100 | #313 | Tragic 7.1% |
| Blackfeet | 0.0 /100 | #314 | Tragic 7.1% |
| Shoshone | 0.0 /100 | #315 | Tragic 7.1% |
| Immigrants | Dominican Republic | 0.0 /100 | #316 | Tragic 7.1% |
| Central American Indians | 0.0 /100 | #317 | Tragic 7.2% |
| Ottawa | 0.0 /100 | #318 | Tragic 7.2% |
| Dominicans | 0.0 /100 | #319 | Tragic 7.2% |
| Potawatomi | 0.0 /100 | #320 | Tragic 7.3% |
| Apache | 0.0 /100 | #321 | Tragic 7.4% |