Aleut vs Swedish Ambulatory Disability
COMPARE
Aleut
Swedish
Ambulatory Disability
Ambulatory Disability Comparison
Aleuts
Swedes
6.6%
AMBULATORY DISABILITY
0.4/ 100
METRIC RATING
259th/ 347
METRIC RANK
6.0%
AMBULATORY DISABILITY
83.1/ 100
METRIC RATING
141st/ 347
METRIC RANK
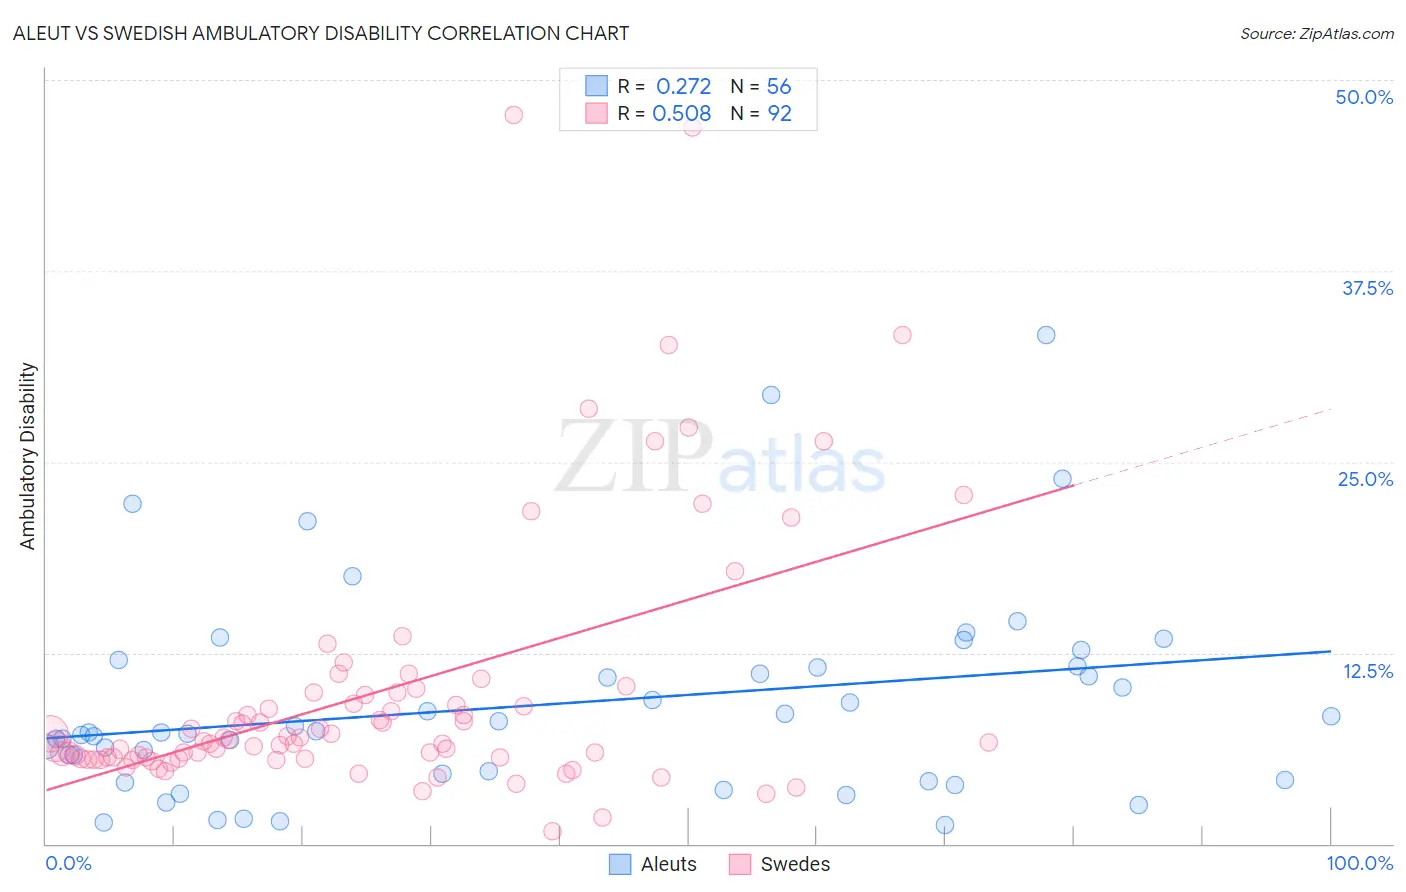
Aleut vs Swedish Ambulatory Disability Correlation Chart
The statistical analysis conducted on geographies consisting of 61,775,810 people shows a weak positive correlation between the proportion of Aleuts and percentage of population with ambulatory disability in the United States with a correlation coefficient (R) of 0.272 and weighted average of 6.6%. Similarly, the statistical analysis conducted on geographies consisting of 538,852,545 people shows a substantial positive correlation between the proportion of Swedes and percentage of population with ambulatory disability in the United States with a correlation coefficient (R) of 0.508 and weighted average of 6.0%, a difference of 9.5%.
Ambulatory Disability Correlation Summary
| Measurement | Aleut | Swedish |
| Minimum | 1.2% | 0.84% |
| Maximum | 33.3% | 47.7% |
| Range | 32.1% | 46.9% |
| Mean | 9.1% | 9.9% |
| Median | 7.3% | 6.7% |
| Interquartile 25% (IQ1) | 4.4% | 5.6% |
| Interquartile 75% (IQ3) | 11.6% | 9.8% |
| Interquartile Range (IQR) | 7.2% | 4.3% |
| Standard Deviation (Sample) | 6.7% | 8.7% |
| Standard Deviation (Population) | 6.6% | 8.6% |
Similar Demographics by Ambulatory Disability
Demographics Similar to Aleuts by Ambulatory Disability
In terms of ambulatory disability, the demographic groups most similar to Aleuts are Immigrants from Belize (6.6%, a difference of 0.010%), Irish (6.6%, a difference of 0.080%), Spanish American Indian (6.5%, a difference of 0.18%), English (6.6%, a difference of 0.25%), and Bermudan (6.5%, a difference of 0.26%).
| Demographics | Rating | Rank | Ambulatory Disability |
| Immigrants | Bahamas | 0.8 /100 | #252 | Tragic 6.5% |
| Scottish | 0.7 /100 | #253 | Tragic 6.5% |
| Belizeans | 0.7 /100 | #254 | Tragic 6.5% |
| Welsh | 0.6 /100 | #255 | Tragic 6.5% |
| Immigrants | Uzbekistan | 0.6 /100 | #256 | Tragic 6.5% |
| Bermudans | 0.5 /100 | #257 | Tragic 6.5% |
| Spanish American Indians | 0.5 /100 | #258 | Tragic 6.5% |
| Aleuts | 0.4 /100 | #259 | Tragic 6.6% |
| Immigrants | Belize | 0.4 /100 | #260 | Tragic 6.6% |
| Irish | 0.4 /100 | #261 | Tragic 6.6% |
| English | 0.4 /100 | #262 | Tragic 6.6% |
| Hmong | 0.3 /100 | #263 | Tragic 6.6% |
| Nepalese | 0.2 /100 | #264 | Tragic 6.6% |
| Bahamians | 0.2 /100 | #265 | Tragic 6.6% |
| Guyanese | 0.2 /100 | #266 | Tragic 6.6% |
Demographics Similar to Swedes by Ambulatory Disability
In terms of ambulatory disability, the demographic groups most similar to Swedes are Immigrants from Philippines (6.0%, a difference of 0.010%), Czech (6.0%, a difference of 0.020%), Romanian (6.0%, a difference of 0.020%), Macedonian (6.0%, a difference of 0.030%), and Immigrants from Zaire (6.0%, a difference of 0.050%).
| Demographics | Rating | Rank | Ambulatory Disability |
| Ute | 86.6 /100 | #134 | Excellent 6.0% |
| Immigrants | Italy | 85.0 /100 | #135 | Excellent 6.0% |
| Immigrants | North Macedonia | 84.1 /100 | #136 | Excellent 6.0% |
| Immigrants | Syria | 84.1 /100 | #137 | Excellent 6.0% |
| Immigrants | Hungary | 83.9 /100 | #138 | Excellent 6.0% |
| Immigrants | Zaire | 83.6 /100 | #139 | Excellent 6.0% |
| Czechs | 83.3 /100 | #140 | Excellent 6.0% |
| Swedes | 83.1 /100 | #141 | Excellent 6.0% |
| Immigrants | Philippines | 83.0 /100 | #142 | Excellent 6.0% |
| Romanians | 82.9 /100 | #143 | Excellent 6.0% |
| Macedonians | 82.8 /100 | #144 | Excellent 6.0% |
| Pakistanis | 82.5 /100 | #145 | Excellent 6.0% |
| Immigrants | Greece | 82.5 /100 | #146 | Excellent 6.0% |
| Immigrants | Moldova | 82.4 /100 | #147 | Excellent 6.0% |
| Immigrants | Eastern Europe | 82.0 /100 | #148 | Excellent 6.0% |