Immigrants from Sri Lanka vs Swedish Associate's Degree
COMPARE
Immigrants from Sri Lanka
Swedish
Associate's Degree
Associate's Degree Comparison
Immigrants from Sri Lanka
Swedes
53.7%
ASSOCIATE'S DEGREE
100.0/ 100
METRIC RATING
30th/ 347
METRIC RANK
48.4%
ASSOCIATE'S DEGREE
91.5/ 100
METRIC RATING
129th/ 347
METRIC RANK
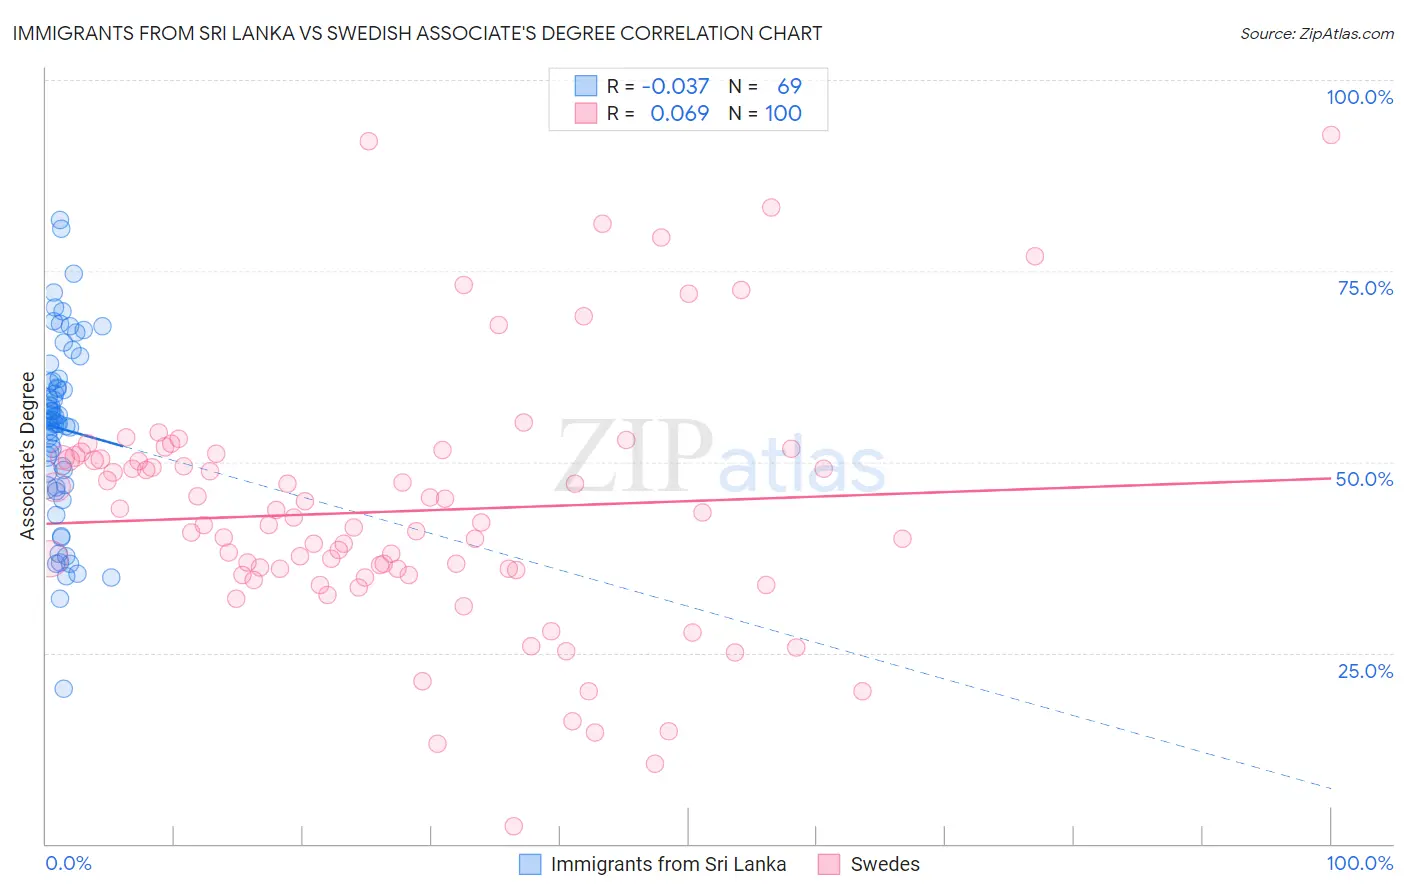
Immigrants from Sri Lanka vs Swedish Associate's Degree Correlation Chart
The statistical analysis conducted on geographies consisting of 149,700,552 people shows no correlation between the proportion of Immigrants from Sri Lanka and percentage of population with at least associate's degree education in the United States with a correlation coefficient (R) of -0.037 and weighted average of 53.7%. Similarly, the statistical analysis conducted on geographies consisting of 539,194,795 people shows a slight positive correlation between the proportion of Swedes and percentage of population with at least associate's degree education in the United States with a correlation coefficient (R) of 0.069 and weighted average of 48.4%, a difference of 10.8%.
Associate's Degree Correlation Summary
| Measurement | Immigrants from Sri Lanka | Swedish |
| Minimum | 20.2% | 2.3% |
| Maximum | 81.7% | 92.9% |
| Range | 61.5% | 90.6% |
| Mean | 54.4% | 43.5% |
| Median | 55.4% | 41.9% |
| Interquartile 25% (IQ1) | 46.8% | 35.6% |
| Interquartile 75% (IQ3) | 60.8% | 50.4% |
| Interquartile Range (IQR) | 13.9% | 14.9% |
| Standard Deviation (Sample) | 11.9% | 16.5% |
| Standard Deviation (Population) | 11.8% | 16.4% |
Similar Demographics by Associate's Degree
Demographics Similar to Immigrants from Sri Lanka by Associate's Degree
In terms of associate's degree, the demographic groups most similar to Immigrants from Sri Lanka are Immigrants from Northern Europe (53.5%, a difference of 0.36%), Immigrants from Turkey (53.4%, a difference of 0.39%), Immigrants from France (53.9%, a difference of 0.42%), Turkish (53.9%, a difference of 0.43%), and Latvian (53.9%, a difference of 0.50%).
| Demographics | Rating | Rank | Associate's Degree |
| Burmese | 100.0 /100 | #23 | Exceptional 54.6% |
| Immigrants | Korea | 100.0 /100 | #24 | Exceptional 54.5% |
| Immigrants | Switzerland | 100.0 /100 | #25 | Exceptional 54.5% |
| Immigrants | Belgium | 100.0 /100 | #26 | Exceptional 54.5% |
| Latvians | 100.0 /100 | #27 | Exceptional 53.9% |
| Turks | 100.0 /100 | #28 | Exceptional 53.9% |
| Immigrants | France | 100.0 /100 | #29 | Exceptional 53.9% |
| Immigrants | Sri Lanka | 100.0 /100 | #30 | Exceptional 53.7% |
| Immigrants | Northern Europe | 100.0 /100 | #31 | Exceptional 53.5% |
| Immigrants | Turkey | 100.0 /100 | #32 | Exceptional 53.4% |
| Israelis | 100.0 /100 | #33 | Exceptional 53.4% |
| Bulgarians | 100.0 /100 | #34 | Exceptional 53.3% |
| Russians | 100.0 /100 | #35 | Exceptional 53.2% |
| Immigrants | Russia | 100.0 /100 | #36 | Exceptional 53.1% |
| Immigrants | Denmark | 100.0 /100 | #37 | Exceptional 53.1% |
Demographics Similar to Swedes by Associate's Degree
In terms of associate's degree, the demographic groups most similar to Swedes are Immigrants from Eastern Africa (48.4%, a difference of 0.030%), Immigrants from Jordan (48.4%, a difference of 0.060%), Immigrants from Uganda (48.5%, a difference of 0.15%), Immigrants from Syria (48.5%, a difference of 0.16%), and Icelander (48.3%, a difference of 0.16%).
| Demographics | Rating | Rank | Associate's Degree |
| Italians | 93.9 /100 | #122 | Exceptional 48.7% |
| Brazilians | 93.7 /100 | #123 | Exceptional 48.7% |
| Serbians | 92.6 /100 | #124 | Exceptional 48.5% |
| Chinese | 92.5 /100 | #125 | Exceptional 48.5% |
| Immigrants | Syria | 92.2 /100 | #126 | Exceptional 48.5% |
| Immigrants | Uganda | 92.1 /100 | #127 | Exceptional 48.5% |
| Immigrants | Eastern Africa | 91.6 /100 | #128 | Exceptional 48.4% |
| Swedes | 91.5 /100 | #129 | Exceptional 48.4% |
| Immigrants | Jordan | 91.2 /100 | #130 | Exceptional 48.4% |
| Icelanders | 90.8 /100 | #131 | Exceptional 48.3% |
| Immigrants | Albania | 89.9 /100 | #132 | Excellent 48.2% |
| Assyrians/Chaldeans/Syriacs | 89.4 /100 | #133 | Excellent 48.2% |
| Moroccans | 89.3 /100 | #134 | Excellent 48.2% |
| Europeans | 89.0 /100 | #135 | Excellent 48.2% |
| Pakistanis | 88.0 /100 | #136 | Excellent 48.1% |