Immigrants from Sri Lanka vs Immigrants from Southern Europe Cognitive Disability
COMPARE
Immigrants from Sri Lanka
Immigrants from Southern Europe
Cognitive Disability
Cognitive Disability Comparison
Immigrants from Sri Lanka
Immigrants from Southern Europe
16.8%
COGNITIVE DISABILITY
97.1/ 100
METRIC RATING
113th/ 347
METRIC RANK
16.7%
COGNITIVE DISABILITY
98.7/ 100
METRIC RATING
93rd/ 347
METRIC RANK
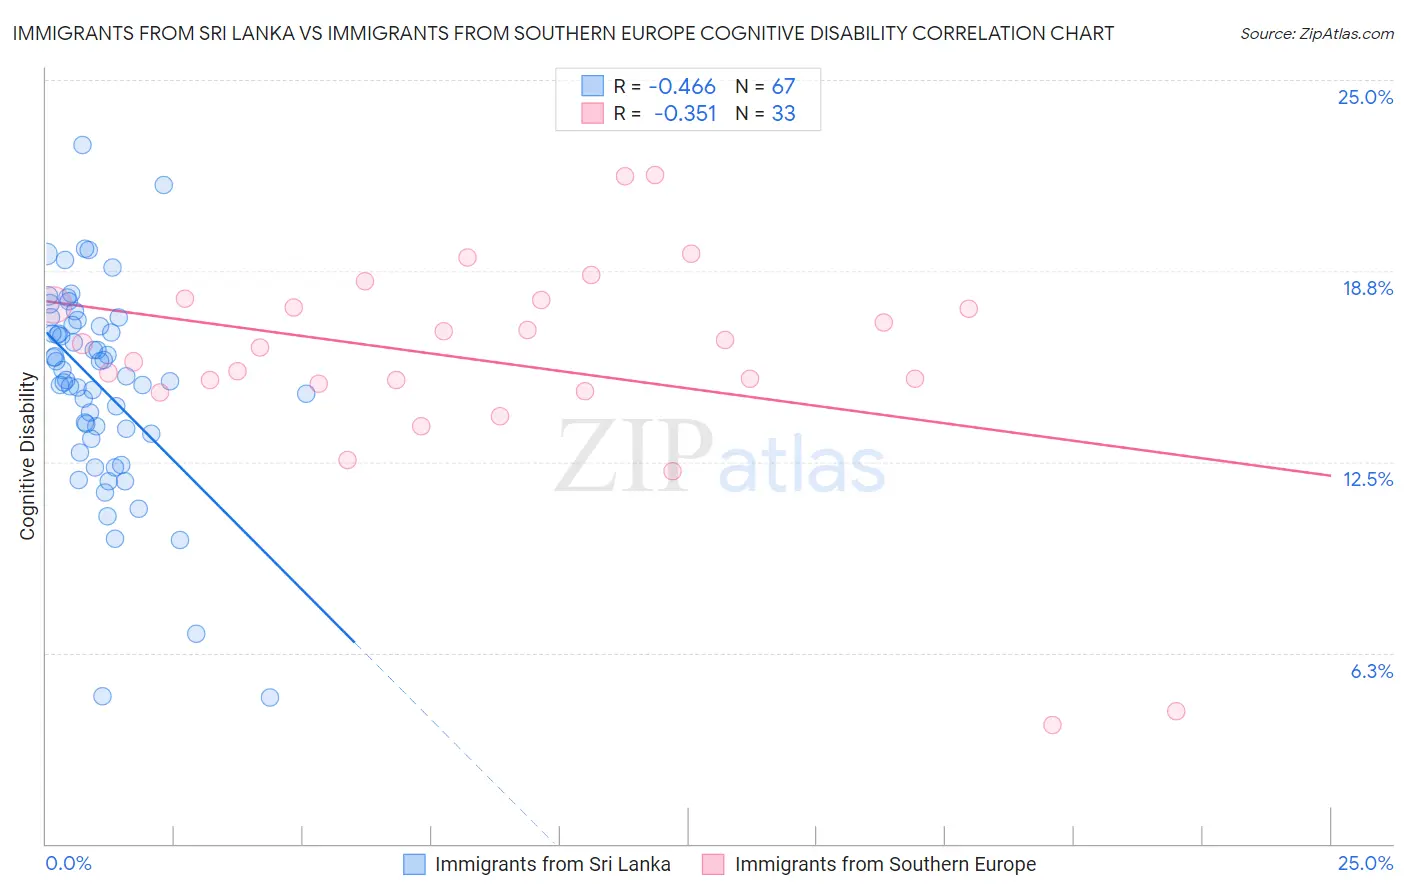
Immigrants from Sri Lanka vs Immigrants from Southern Europe Cognitive Disability Correlation Chart
The statistical analysis conducted on geographies consisting of 149,697,032 people shows a moderate negative correlation between the proportion of Immigrants from Sri Lanka and percentage of population with cognitive disability in the United States with a correlation coefficient (R) of -0.466 and weighted average of 16.8%. Similarly, the statistical analysis conducted on geographies consisting of 402,774,065 people shows a mild negative correlation between the proportion of Immigrants from Southern Europe and percentage of population with cognitive disability in the United States with a correlation coefficient (R) of -0.351 and weighted average of 16.7%, a difference of 0.62%.
Cognitive Disability Correlation Summary
| Measurement | Immigrants from Sri Lanka | Immigrants from Southern Europe |
| Minimum | 4.8% | 3.9% |
| Maximum | 22.9% | 21.9% |
| Range | 18.1% | 18.0% |
| Mean | 15.0% | 15.8% |
| Median | 15.3% | 16.3% |
| Interquartile 25% (IQ1) | 13.4% | 14.9% |
| Interquartile 75% (IQ3) | 17.0% | 17.7% |
| Interquartile Range (IQR) | 3.6% | 2.8% |
| Standard Deviation (Sample) | 3.3% | 3.7% |
| Standard Deviation (Population) | 3.3% | 3.7% |
Demographics Similar to Immigrants from Sri Lanka and Immigrants from Southern Europe by Cognitive Disability
In terms of cognitive disability, the demographic groups most similar to Immigrants from Sri Lanka are Indian (Asian) (16.8%, a difference of 0.0%), Uruguayan (16.8%, a difference of 0.030%), Arapaho (16.8%, a difference of 0.040%), Albanian (16.8%, a difference of 0.050%), and Canadian (16.8%, a difference of 0.090%). Similarly, the demographic groups most similar to Immigrants from Southern Europe are Asian (16.7%, a difference of 0.040%), English (16.8%, a difference of 0.11%), Finnish (16.8%, a difference of 0.13%), Dutch (16.8%, a difference of 0.14%), and Immigrants from Lebanon (16.8%, a difference of 0.17%).
| Demographics | Rating | Rank | Cognitive Disability |
| Immigrants | Southern Europe | 98.7 /100 | #93 | Exceptional 16.7% |
| Asians | 98.7 /100 | #94 | Exceptional 16.7% |
| English | 98.6 /100 | #95 | Exceptional 16.8% |
| Finns | 98.5 /100 | #96 | Exceptional 16.8% |
| Dutch | 98.5 /100 | #97 | Exceptional 16.8% |
| Immigrants | Lebanon | 98.4 /100 | #98 | Exceptional 16.8% |
| Jordanians | 98.2 /100 | #99 | Exceptional 16.8% |
| Immigrants | Russia | 98.2 /100 | #100 | Exceptional 16.8% |
| Immigrants | Asia | 98.1 /100 | #101 | Exceptional 16.8% |
| Irish | 98.1 /100 | #102 | Exceptional 16.8% |
| Paraguayans | 98.0 /100 | #103 | Exceptional 16.8% |
| Palestinians | 98.0 /100 | #104 | Exceptional 16.8% |
| Immigrants | Eastern Asia | 97.9 /100 | #105 | Exceptional 16.8% |
| Northern Europeans | 97.8 /100 | #106 | Exceptional 16.8% |
| Immigrants | Nicaragua | 97.8 /100 | #107 | Exceptional 16.8% |
| Canadians | 97.5 /100 | #108 | Exceptional 16.8% |
| Albanians | 97.3 /100 | #109 | Exceptional 16.8% |
| Arapaho | 97.3 /100 | #110 | Exceptional 16.8% |
| Uruguayans | 97.2 /100 | #111 | Exceptional 16.8% |
| Indians (Asian) | 97.2 /100 | #112 | Exceptional 16.8% |
| Immigrants | Sri Lanka | 97.1 /100 | #113 | Exceptional 16.8% |