Immigrants from Spain vs Pakistani Hearing Disability
COMPARE
Immigrants from Spain
Pakistani
Hearing Disability
Hearing Disability Comparison
Immigrants from Spain
Pakistanis
2.8%
HEARING DISABILITY
94.9/ 100
METRIC RATING
101st/ 347
METRIC RANK
3.1%
HEARING DISABILITY
11.1/ 100
METRIC RATING
212th/ 347
METRIC RANK
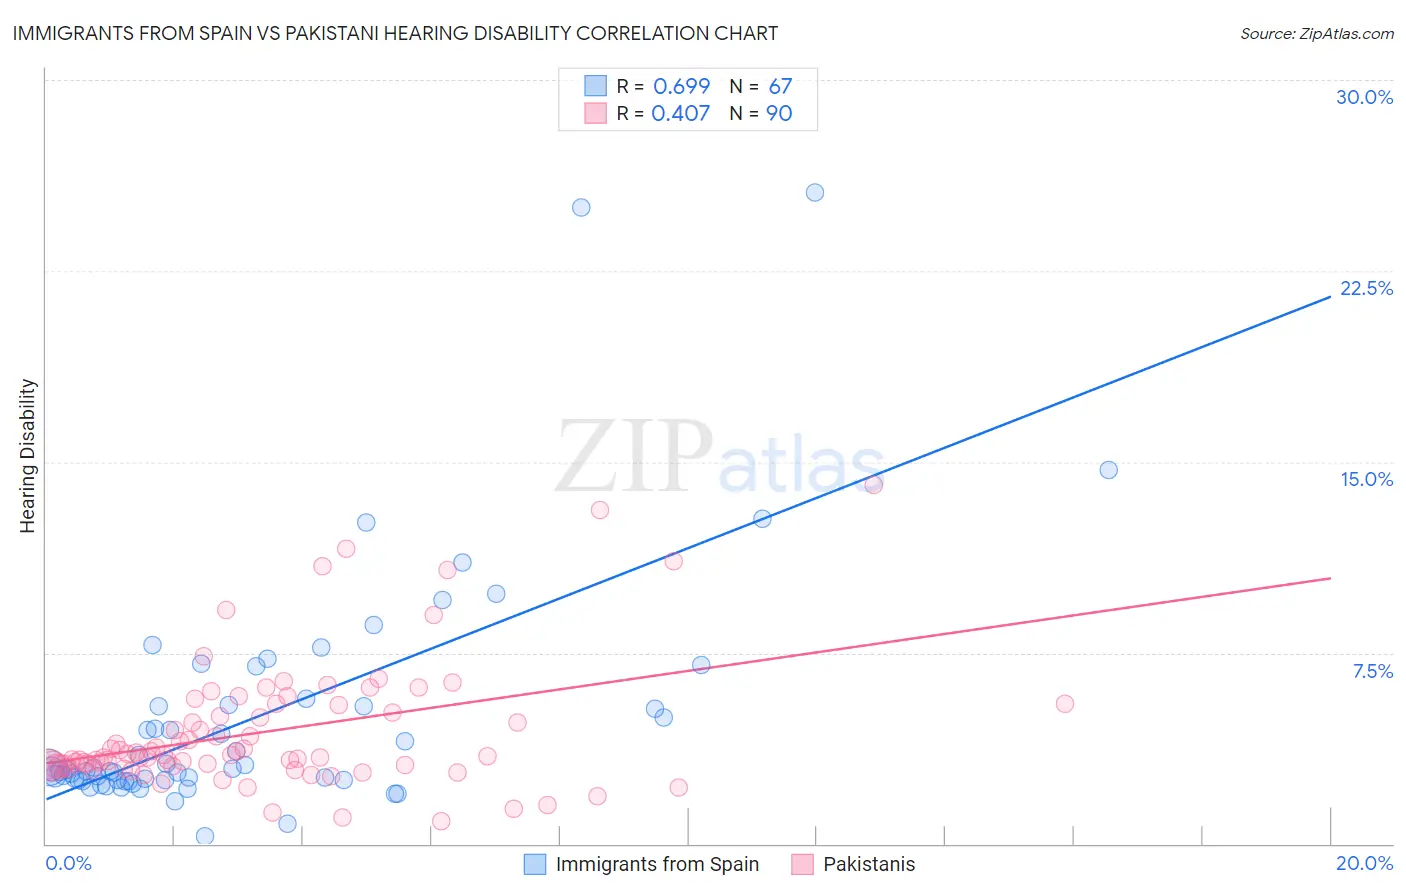
Immigrants from Spain vs Pakistani Hearing Disability Correlation Chart
The statistical analysis conducted on geographies consisting of 239,646,131 people shows a significant positive correlation between the proportion of Immigrants from Spain and percentage of population with hearing disability in the United States with a correlation coefficient (R) of 0.699 and weighted average of 2.8%. Similarly, the statistical analysis conducted on geographies consisting of 335,217,185 people shows a moderate positive correlation between the proportion of Pakistanis and percentage of population with hearing disability in the United States with a correlation coefficient (R) of 0.407 and weighted average of 3.1%, a difference of 12.6%.
Hearing Disability Correlation Summary
| Measurement | Immigrants from Spain | Pakistani |
| Minimum | 0.32% | 0.88% |
| Maximum | 25.6% | 14.1% |
| Range | 25.3% | 13.2% |
| Mean | 4.9% | 4.4% |
| Median | 2.9% | 3.5% |
| Interquartile 25% (IQ1) | 2.5% | 3.0% |
| Interquartile 75% (IQ3) | 5.4% | 5.4% |
| Interquartile Range (IQR) | 2.9% | 2.4% |
| Standard Deviation (Sample) | 4.7% | 2.6% |
| Standard Deviation (Population) | 4.6% | 2.5% |
Similar Demographics by Hearing Disability
Demographics Similar to Immigrants from Spain by Hearing Disability
In terms of hearing disability, the demographic groups most similar to Immigrants from Spain are Taiwanese (2.8%, a difference of 0.010%), Immigrants from Eastern Africa (2.8%, a difference of 0.050%), Immigrants from Indonesia (2.8%, a difference of 0.060%), Immigrants from Guatemala (2.8%, a difference of 0.11%), and Immigrants from Honduras (2.8%, a difference of 0.15%).
| Demographics | Rating | Rank | Hearing Disability |
| Uruguayans | 95.9 /100 | #94 | Exceptional 2.8% |
| Israelis | 95.9 /100 | #95 | Exceptional 2.8% |
| Immigrants | Somalia | 95.5 /100 | #96 | Exceptional 2.8% |
| Immigrants | Afghanistan | 95.3 /100 | #97 | Exceptional 2.8% |
| Immigrants | Honduras | 95.1 /100 | #98 | Exceptional 2.8% |
| Immigrants | Guatemala | 95.1 /100 | #99 | Exceptional 2.8% |
| Immigrants | Eastern Africa | 95.0 /100 | #100 | Exceptional 2.8% |
| Immigrants | Spain | 94.9 /100 | #101 | Exceptional 2.8% |
| Taiwanese | 94.8 /100 | #102 | Exceptional 2.8% |
| Immigrants | Indonesia | 94.7 /100 | #103 | Exceptional 2.8% |
| Burmese | 94.2 /100 | #104 | Exceptional 2.8% |
| Moroccans | 93.9 /100 | #105 | Exceptional 2.8% |
| Hondurans | 93.4 /100 | #106 | Exceptional 2.8% |
| Immigrants | Chile | 93.4 /100 | #107 | Exceptional 2.8% |
| Guatemalans | 93.2 /100 | #108 | Exceptional 2.8% |
Demographics Similar to Pakistanis by Hearing Disability
In terms of hearing disability, the demographic groups most similar to Pakistanis are Immigrants from Iraq (3.1%, a difference of 0.15%), Romanian (3.1%, a difference of 0.21%), Cape Verdean (3.1%, a difference of 0.25%), Immigrants from Hungary (3.1%, a difference of 0.29%), and Immigrants from Latvia (3.1%, a difference of 0.33%).
| Demographics | Rating | Rank | Hearing Disability |
| Alsatians | 15.9 /100 | #205 | Poor 3.1% |
| Eastern Europeans | 15.5 /100 | #206 | Poor 3.1% |
| Hispanics or Latinos | 15.1 /100 | #207 | Poor 3.1% |
| Immigrants | Latvia | 12.7 /100 | #208 | Poor 3.1% |
| Immigrants | Hungary | 12.5 /100 | #209 | Poor 3.1% |
| Cape Verdeans | 12.2 /100 | #210 | Poor 3.1% |
| Romanians | 12.1 /100 | #211 | Poor 3.1% |
| Pakistanis | 11.1 /100 | #212 | Poor 3.1% |
| Immigrants | Iraq | 10.5 /100 | #213 | Poor 3.1% |
| Australians | 8.1 /100 | #214 | Tragic 3.2% |
| Bangladeshis | 8.1 /100 | #215 | Tragic 3.2% |
| Immigrants | Norway | 7.3 /100 | #216 | Tragic 3.2% |
| Russians | 7.1 /100 | #217 | Tragic 3.2% |
| Immigrants | Northern Europe | 7.0 /100 | #218 | Tragic 3.2% |
| New Zealanders | 6.8 /100 | #219 | Tragic 3.2% |