Immigrants from Spain vs Immigrants from Australia Female Unemployment
COMPARE
Immigrants from Spain
Immigrants from Australia
Female Unemployment
Female Unemployment Comparison
Immigrants from Spain
Immigrants from Australia
5.2%
FEMALE UNEMPLOYMENT
66.8/ 100
METRIC RATING
160th/ 347
METRIC RANK
5.0%
FEMALE UNEMPLOYMENT
97.3/ 100
METRIC RATING
82nd/ 347
METRIC RANK
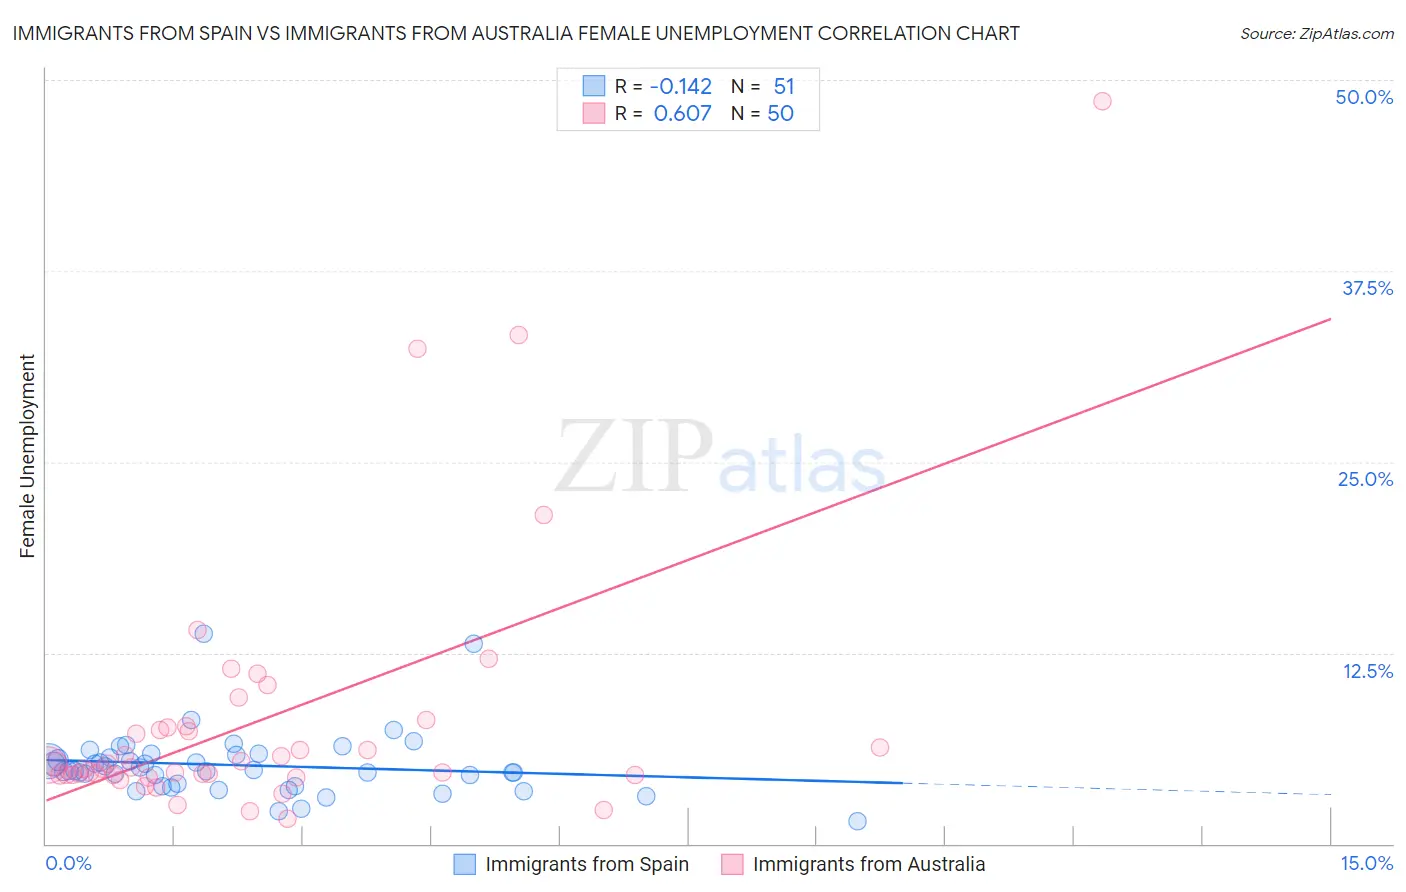
Immigrants from Spain vs Immigrants from Australia Female Unemployment Correlation Chart
The statistical analysis conducted on geographies consisting of 239,203,477 people shows a poor negative correlation between the proportion of Immigrants from Spain and unemploymnet rate among females in the United States with a correlation coefficient (R) of -0.142 and weighted average of 5.2%. Similarly, the statistical analysis conducted on geographies consisting of 226,659,190 people shows a significant positive correlation between the proportion of Immigrants from Australia and unemploymnet rate among females in the United States with a correlation coefficient (R) of 0.607 and weighted average of 5.0%, a difference of 4.6%.
Female Unemployment Correlation Summary
| Measurement | Immigrants from Spain | Immigrants from Australia |
| Minimum | 1.5% | 1.6% |
| Maximum | 13.8% | 48.6% |
| Range | 12.3% | 47.0% |
| Mean | 5.1% | 8.1% |
| Median | 4.8% | 5.1% |
| Interquartile 25% (IQ1) | 3.8% | 4.5% |
| Interquartile 75% (IQ3) | 5.8% | 7.6% |
| Interquartile Range (IQR) | 2.0% | 3.1% |
| Standard Deviation (Sample) | 2.1% | 8.6% |
| Standard Deviation (Population) | 2.1% | 8.5% |
Similar Demographics by Female Unemployment
Demographics Similar to Immigrants from Spain by Female Unemployment
In terms of female unemployment, the demographic groups most similar to Immigrants from Spain are Immigrants from Pakistan (5.2%, a difference of 0.0%), Immigrants from Micronesia (5.2%, a difference of 0.010%), Potawatomi (5.2%, a difference of 0.060%), Albanian (5.2%, a difference of 0.11%), and Immigrants from Asia (5.2%, a difference of 0.17%).
| Demographics | Rating | Rank | Female Unemployment |
| Immigrants | Greece | 74.9 /100 | #153 | Good 5.2% |
| South Africans | 70.8 /100 | #154 | Good 5.2% |
| Immigrants | Egypt | 70.0 /100 | #155 | Good 5.2% |
| Immigrants | Northern Africa | 69.6 /100 | #156 | Good 5.2% |
| Immigrants | Russia | 69.3 /100 | #157 | Good 5.2% |
| Albanians | 68.3 /100 | #158 | Good 5.2% |
| Immigrants | Micronesia | 66.9 /100 | #159 | Good 5.2% |
| Immigrants | Spain | 66.8 /100 | #160 | Good 5.2% |
| Immigrants | Pakistan | 66.7 /100 | #161 | Good 5.2% |
| Potawatomi | 65.9 /100 | #162 | Good 5.2% |
| Immigrants | Asia | 64.3 /100 | #163 | Good 5.2% |
| Bangladeshis | 64.3 /100 | #164 | Good 5.2% |
| Syrians | 62.8 /100 | #165 | Good 5.2% |
| Native Hawaiians | 62.7 /100 | #166 | Good 5.2% |
| Immigrants | Thailand | 62.1 /100 | #167 | Good 5.2% |
Demographics Similar to Immigrants from Australia by Female Unemployment
In terms of female unemployment, the demographic groups most similar to Immigrants from Australia are Immigrants from Serbia (5.0%, a difference of 0.020%), Filipino (5.0%, a difference of 0.050%), Canadian (5.0%, a difference of 0.050%), New Zealander (5.0%, a difference of 0.070%), and Ukrainian (5.0%, a difference of 0.090%).
| Demographics | Rating | Rank | Female Unemployment |
| Immigrants | Singapore | 98.0 /100 | #75 | Exceptional 5.0% |
| Immigrants | Venezuela | 97.9 /100 | #76 | Exceptional 5.0% |
| Mongolians | 97.8 /100 | #77 | Exceptional 5.0% |
| Immigrants | Netherlands | 97.8 /100 | #78 | Exceptional 5.0% |
| Turks | 97.6 /100 | #79 | Exceptional 5.0% |
| New Zealanders | 97.4 /100 | #80 | Exceptional 5.0% |
| Filipinos | 97.3 /100 | #81 | Exceptional 5.0% |
| Immigrants | Australia | 97.3 /100 | #82 | Exceptional 5.0% |
| Immigrants | Serbia | 97.2 /100 | #83 | Exceptional 5.0% |
| Canadians | 97.2 /100 | #84 | Exceptional 5.0% |
| Ukrainians | 97.1 /100 | #85 | Exceptional 5.0% |
| Bolivians | 97.1 /100 | #86 | Exceptional 5.0% |
| Venezuelans | 96.9 /100 | #87 | Exceptional 5.0% |
| Immigrants | Sudan | 96.7 /100 | #88 | Exceptional 5.0% |
| Immigrants | Taiwan | 96.6 /100 | #89 | Exceptional 5.0% |