Immigrants from Latin America vs Dominican Male Disability
COMPARE
Immigrants from Latin America
Dominican
Male Disability
Male Disability Comparison
Immigrants from Latin America
Dominicans
11.2%
MALE DISABILITY
54.0/ 100
METRIC RATING
168th/ 347
METRIC RANK
11.8%
MALE DISABILITY
1.8/ 100
METRIC RATING
231st/ 347
METRIC RANK
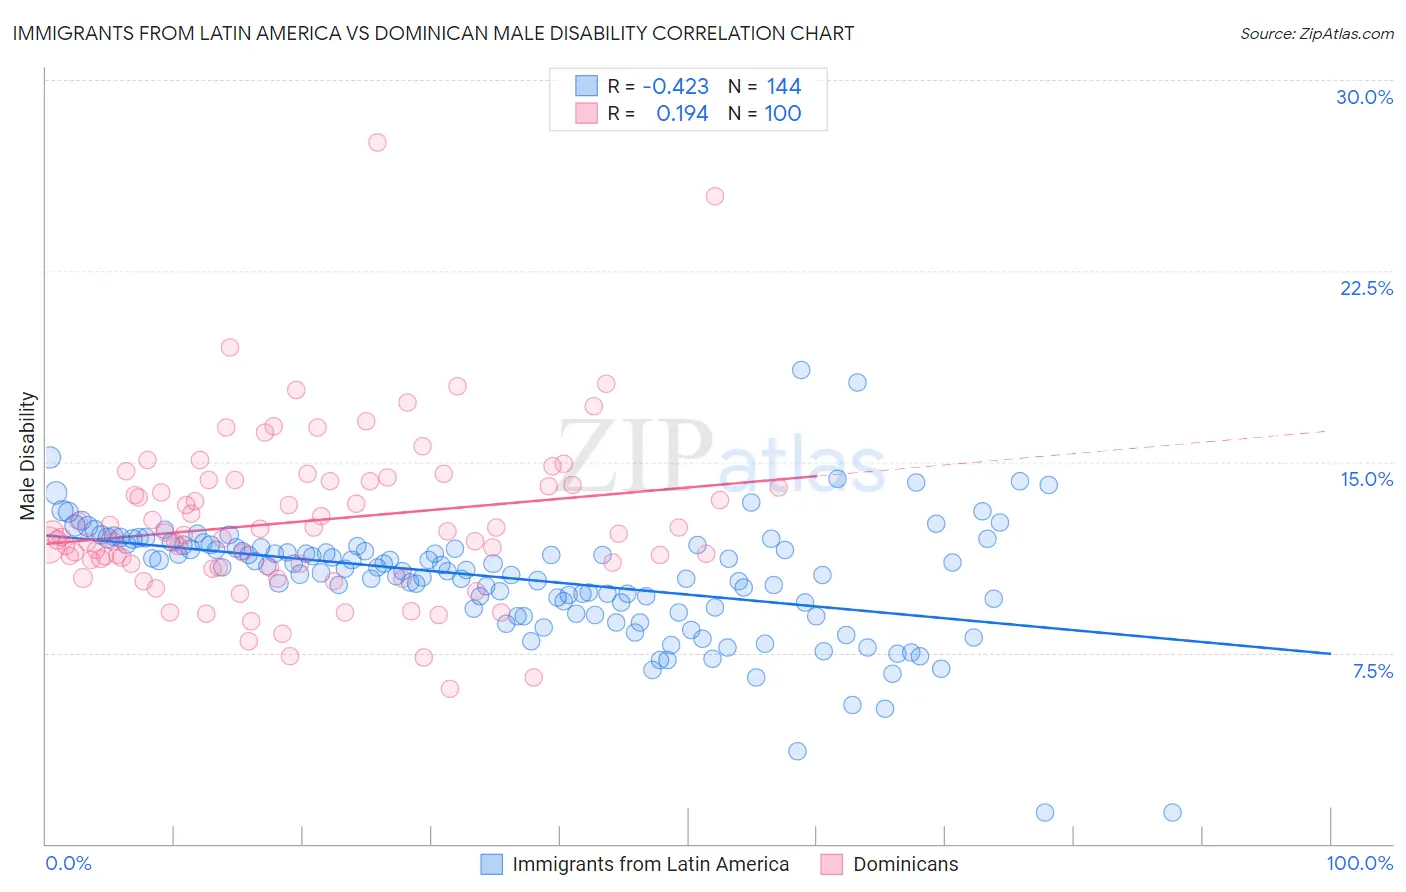
Immigrants from Latin America vs Dominican Male Disability Correlation Chart
The statistical analysis conducted on geographies consisting of 558,326,856 people shows a moderate negative correlation between the proportion of Immigrants from Latin America and percentage of males with a disability in the United States with a correlation coefficient (R) of -0.423 and weighted average of 11.2%. Similarly, the statistical analysis conducted on geographies consisting of 355,013,685 people shows a poor positive correlation between the proportion of Dominicans and percentage of males with a disability in the United States with a correlation coefficient (R) of 0.194 and weighted average of 11.8%, a difference of 5.7%.
Male Disability Correlation Summary
| Measurement | Immigrants from Latin America | Dominican |
| Minimum | 1.2% | 6.1% |
| Maximum | 18.6% | 27.5% |
| Range | 17.4% | 21.4% |
| Mean | 10.4% | 12.7% |
| Median | 10.8% | 12.1% |
| Interquartile 25% (IQ1) | 9.2% | 11.0% |
| Interquartile 75% (IQ3) | 11.7% | 14.3% |
| Interquartile Range (IQR) | 2.5% | 3.3% |
| Standard Deviation (Sample) | 2.4% | 3.3% |
| Standard Deviation (Population) | 2.4% | 3.3% |
Similar Demographics by Male Disability
Demographics Similar to Immigrants from Latin America by Male Disability
In terms of male disability, the demographic groups most similar to Immigrants from Latin America are Immigrants from Southern Europe (11.2%, a difference of 0.020%), Barbadian (11.2%, a difference of 0.030%), New Zealander (11.2%, a difference of 0.060%), Haitian (11.2%, a difference of 0.080%), and Romanian (11.2%, a difference of 0.18%).
| Demographics | Rating | Rank | Male Disability |
| Immigrants | West Indies | 65.7 /100 | #161 | Good 11.1% |
| Immigrants | Haiti | 65.3 /100 | #162 | Good 11.1% |
| Immigrants | Kenya | 63.8 /100 | #163 | Good 11.1% |
| British West Indians | 62.8 /100 | #164 | Good 11.1% |
| Luxembourgers | 61.9 /100 | #165 | Good 11.1% |
| Immigrants | Hungary | 61.2 /100 | #166 | Good 11.1% |
| Immigrants | Southern Europe | 54.4 /100 | #167 | Average 11.2% |
| Immigrants | Latin America | 54.0 /100 | #168 | Average 11.2% |
| Barbadians | 53.4 /100 | #169 | Average 11.2% |
| New Zealanders | 52.9 /100 | #170 | Average 11.2% |
| Haitians | 52.5 /100 | #171 | Average 11.2% |
| Romanians | 50.7 /100 | #172 | Average 11.2% |
| Immigrants | Burma/Myanmar | 50.4 /100 | #173 | Average 11.2% |
| Maltese | 50.0 /100 | #174 | Average 11.2% |
| Immigrants | Honduras | 48.7 /100 | #175 | Average 11.2% |
Demographics Similar to Dominicans by Male Disability
In terms of male disability, the demographic groups most similar to Dominicans are Malaysian (11.8%, a difference of 0.060%), Mexican (11.8%, a difference of 0.10%), Immigrants from Canada (11.9%, a difference of 0.18%), Croatian (11.8%, a difference of 0.20%), and Bermudan (11.8%, a difference of 0.28%).
| Demographics | Rating | Rank | Male Disability |
| Japanese | 3.1 /100 | #224 | Tragic 11.7% |
| Liberians | 3.1 /100 | #225 | Tragic 11.8% |
| Sub-Saharan Africans | 2.8 /100 | #226 | Tragic 11.8% |
| Austrians | 2.5 /100 | #227 | Tragic 11.8% |
| Hispanics or Latinos | 2.3 /100 | #228 | Tragic 11.8% |
| Bermudans | 2.3 /100 | #229 | Tragic 11.8% |
| Croatians | 2.1 /100 | #230 | Tragic 11.8% |
| Dominicans | 1.8 /100 | #231 | Tragic 11.8% |
| Malaysians | 1.8 /100 | #232 | Tragic 11.8% |
| Mexicans | 1.7 /100 | #233 | Tragic 11.8% |
| Immigrants | Canada | 1.6 /100 | #234 | Tragic 11.9% |
| Immigrants | North America | 1.5 /100 | #235 | Tragic 11.9% |
| U.S. Virgin Islanders | 1.3 /100 | #236 | Tragic 11.9% |
| Carpatho Rusyns | 1.3 /100 | #237 | Tragic 11.9% |
| Yugoslavians | 1.2 /100 | #238 | Tragic 11.9% |