Immigrants from Spain vs Bolivian Unemployment Among Seniors over 65 years
COMPARE
Immigrants from Spain
Bolivian
Unemployment Among Seniors over 65 years
Unemployment Among Seniors over 65 years Comparison
Immigrants from Spain
Bolivians
5.1%
UNEMPLOYMENT AMONG SENIORS OVER 65 YEARS
51.7/ 100
METRIC RATING
173rd/ 347
METRIC RANK
4.9%
UNEMPLOYMENT AMONG SENIORS OVER 65 YEARS
99.5/ 100
METRIC RATING
68th/ 347
METRIC RANK
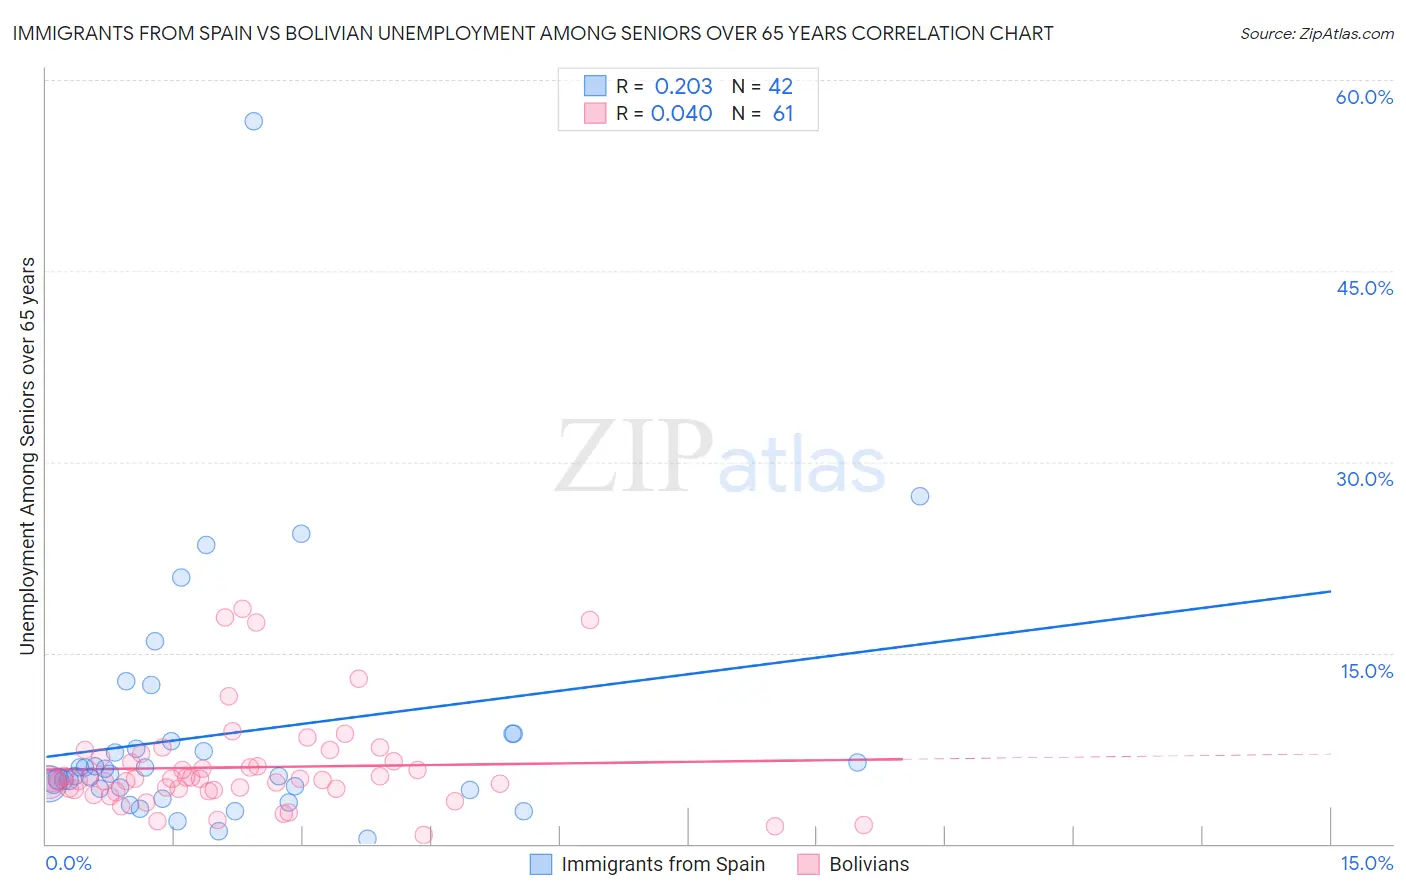
Immigrants from Spain vs Bolivian Unemployment Among Seniors over 65 years Correlation Chart
The statistical analysis conducted on geographies consisting of 226,185,569 people shows a weak positive correlation between the proportion of Immigrants from Spain and unemployment rate amomg seniors over the age of 65 in the United States with a correlation coefficient (R) of 0.203 and weighted average of 5.1%. Similarly, the statistical analysis conducted on geographies consisting of 175,612,464 people shows no correlation between the proportion of Bolivians and unemployment rate amomg seniors over the age of 65 in the United States with a correlation coefficient (R) of 0.040 and weighted average of 4.9%, a difference of 4.4%.
Unemployment Among Seniors over 65 years Correlation Summary
| Measurement | Immigrants from Spain | Bolivian |
| Minimum | 0.40% | 0.70% |
| Maximum | 56.8% | 18.5% |
| Range | 56.4% | 17.8% |
| Mean | 8.6% | 6.0% |
| Median | 5.4% | 5.1% |
| Interquartile 25% (IQ1) | 4.3% | 4.3% |
| Interquartile 75% (IQ3) | 8.0% | 6.7% |
| Interquartile Range (IQR) | 3.7% | 2.4% |
| Standard Deviation (Sample) | 9.8% | 3.8% |
| Standard Deviation (Population) | 9.7% | 3.8% |
Similar Demographics by Unemployment Among Seniors over 65 years
Demographics Similar to Immigrants from Spain by Unemployment Among Seniors over 65 years
In terms of unemployment among seniors over 65 years, the demographic groups most similar to Immigrants from Spain are Immigrants from Ireland (5.1%, a difference of 0.050%), Spanish American (5.1%, a difference of 0.050%), Immigrants from Eastern Europe (5.1%, a difference of 0.060%), Nonimmigrants (5.1%, a difference of 0.080%), and Immigrants from Eastern Asia (5.1%, a difference of 0.10%).
| Demographics | Rating | Rank | Unemployment Among Seniors over 65 years |
| Immigrants | Laos | 63.8 /100 | #166 | Good 5.1% |
| Immigrants | Western Europe | 60.4 /100 | #167 | Good 5.1% |
| Mongolians | 59.8 /100 | #168 | Average 5.1% |
| Lithuanians | 58.2 /100 | #169 | Average 5.1% |
| Immigrants | Eastern Asia | 54.9 /100 | #170 | Average 5.1% |
| Immigrants | Nonimmigrants | 54.1 /100 | #171 | Average 5.1% |
| Immigrants | Ireland | 53.2 /100 | #172 | Average 5.1% |
| Immigrants | Spain | 51.7 /100 | #173 | Average 5.1% |
| Spanish Americans | 50.0 /100 | #174 | Average 5.1% |
| Immigrants | Eastern Europe | 49.8 /100 | #175 | Average 5.1% |
| Indians (Asian) | 46.6 /100 | #176 | Average 5.2% |
| Icelanders | 45.9 /100 | #177 | Average 5.2% |
| Immigrants | Belgium | 44.8 /100 | #178 | Average 5.2% |
| Immigrants | Somalia | 44.0 /100 | #179 | Average 5.2% |
| Russians | 43.6 /100 | #180 | Average 5.2% |
Demographics Similar to Bolivians by Unemployment Among Seniors over 65 years
In terms of unemployment among seniors over 65 years, the demographic groups most similar to Bolivians are Iroquois (4.9%, a difference of 0.030%), Scottish (4.9%, a difference of 0.040%), English (4.9%, a difference of 0.060%), Immigrants from Nicaragua (4.9%, a difference of 0.10%), and Immigrants from Kazakhstan (4.9%, a difference of 0.12%).
| Demographics | Rating | Rank | Unemployment Among Seniors over 65 years |
| Northern Europeans | 99.7 /100 | #61 | Exceptional 4.9% |
| Latvians | 99.6 /100 | #62 | Exceptional 4.9% |
| Croatians | 99.6 /100 | #63 | Exceptional 4.9% |
| Immigrants | Cambodia | 99.6 /100 | #64 | Exceptional 4.9% |
| Immigrants | Nicaragua | 99.6 /100 | #65 | Exceptional 4.9% |
| English | 99.5 /100 | #66 | Exceptional 4.9% |
| Iroquois | 99.5 /100 | #67 | Exceptional 4.9% |
| Bolivians | 99.5 /100 | #68 | Exceptional 4.9% |
| Scottish | 99.5 /100 | #69 | Exceptional 4.9% |
| Immigrants | Kazakhstan | 99.4 /100 | #70 | Exceptional 4.9% |
| Immigrants | Moldova | 99.4 /100 | #71 | Exceptional 4.9% |
| Nicaraguans | 99.3 /100 | #72 | Exceptional 4.9% |
| Immigrants | Japan | 99.2 /100 | #73 | Exceptional 4.9% |
| Japanese | 99.2 /100 | #74 | Exceptional 4.9% |
| British | 99.1 /100 | #75 | Exceptional 4.9% |