Chilean vs Bolivian Male Disability
COMPARE
Chilean
Bolivian
Male Disability
Male Disability Comparison
Chileans
Bolivians
10.7%
MALE DISABILITY
96.9/ 100
METRIC RATING
95th/ 347
METRIC RANK
9.6%
MALE DISABILITY
100.0/ 100
METRIC RATING
12th/ 347
METRIC RANK
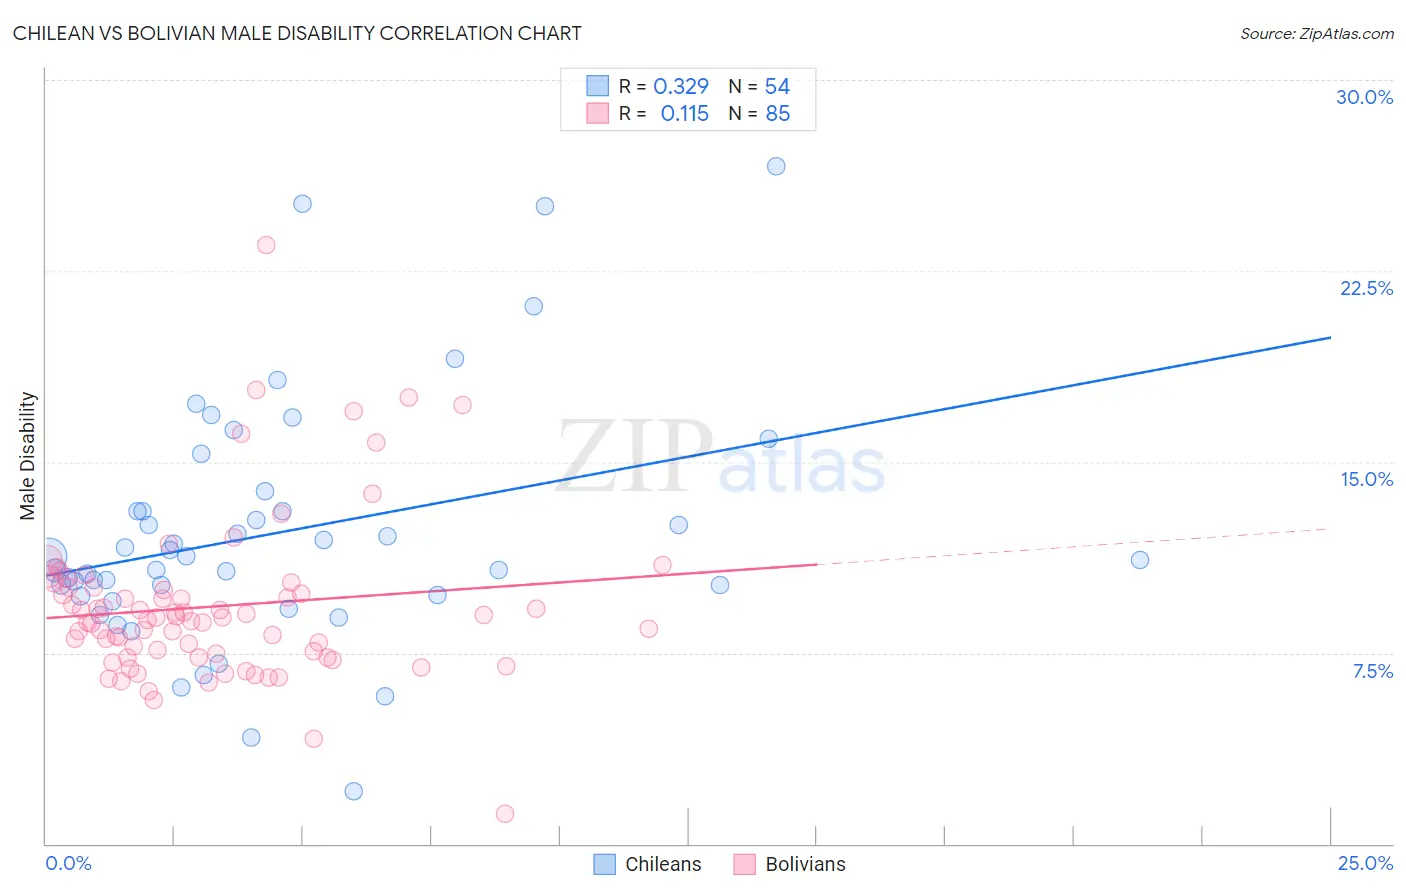
Chilean vs Bolivian Male Disability Correlation Chart
The statistical analysis conducted on geographies consisting of 256,663,212 people shows a mild positive correlation between the proportion of Chileans and percentage of males with a disability in the United States with a correlation coefficient (R) of 0.329 and weighted average of 10.7%. Similarly, the statistical analysis conducted on geographies consisting of 184,652,899 people shows a poor positive correlation between the proportion of Bolivians and percentage of males with a disability in the United States with a correlation coefficient (R) of 0.115 and weighted average of 9.6%, a difference of 10.8%.
Male Disability Correlation Summary
| Measurement | Chilean | Bolivian |
| Minimum | 2.1% | 1.2% |
| Maximum | 26.6% | 23.5% |
| Range | 24.5% | 22.3% |
| Mean | 12.2% | 9.3% |
| Median | 11.2% | 8.9% |
| Interquartile 25% (IQ1) | 9.8% | 7.4% |
| Interquartile 75% (IQ3) | 13.1% | 10.1% |
| Interquartile Range (IQR) | 3.3% | 2.7% |
| Standard Deviation (Sample) | 4.8% | 3.2% |
| Standard Deviation (Population) | 4.8% | 3.2% |
Similar Demographics by Male Disability
Demographics Similar to Chileans by Male Disability
In terms of male disability, the demographic groups most similar to Chileans are Immigrants from Sweden (10.7%, a difference of 0.030%), Nicaraguan (10.7%, a difference of 0.10%), Immigrants from Armenia (10.7%, a difference of 0.12%), Immigrants from St. Vincent and the Grenadines (10.7%, a difference of 0.14%), and Immigrants from Romania (10.7%, a difference of 0.18%).
| Demographics | Rating | Rank | Male Disability |
| Immigrants | Western Asia | 97.8 /100 | #88 | Exceptional 10.6% |
| Immigrants | Nicaragua | 97.8 /100 | #89 | Exceptional 10.6% |
| Immigrants | Morocco | 97.7 /100 | #90 | Exceptional 10.6% |
| Immigrants | France | 97.6 /100 | #91 | Exceptional 10.6% |
| Palestinians | 97.4 /100 | #92 | Exceptional 10.7% |
| Immigrants | St. Vincent and the Grenadines | 97.1 /100 | #93 | Exceptional 10.7% |
| Immigrants | Sweden | 96.9 /100 | #94 | Exceptional 10.7% |
| Chileans | 96.9 /100 | #95 | Exceptional 10.7% |
| Nicaraguans | 96.6 /100 | #96 | Exceptional 10.7% |
| Immigrants | Armenia | 96.6 /100 | #97 | Exceptional 10.7% |
| Immigrants | Romania | 96.5 /100 | #98 | Exceptional 10.7% |
| Immigrants | Switzerland | 96.1 /100 | #99 | Exceptional 10.7% |
| Immigrants | Kazakhstan | 95.9 /100 | #100 | Exceptional 10.7% |
| Immigrants | Greece | 95.6 /100 | #101 | Exceptional 10.7% |
| Immigrants | Eastern Europe | 95.3 /100 | #102 | Exceptional 10.7% |
Demographics Similar to Bolivians by Male Disability
In terms of male disability, the demographic groups most similar to Bolivians are Iranian (9.7%, a difference of 0.23%), Immigrants from Eastern Asia (9.6%, a difference of 0.24%), Immigrants from Iran (9.7%, a difference of 0.33%), Indian (Asian) (9.7%, a difference of 0.78%), and Immigrants from Israel (9.6%, a difference of 0.79%).
| Demographics | Rating | Rank | Male Disability |
| Immigrants | Hong Kong | 100.0 /100 | #5 | Exceptional 9.4% |
| Immigrants | South Central Asia | 100.0 /100 | #6 | Exceptional 9.4% |
| Immigrants | Bolivia | 100.0 /100 | #7 | Exceptional 9.5% |
| Immigrants | China | 100.0 /100 | #8 | Exceptional 9.5% |
| Immigrants | Singapore | 100.0 /100 | #9 | Exceptional 9.5% |
| Immigrants | Israel | 100.0 /100 | #10 | Exceptional 9.6% |
| Immigrants | Eastern Asia | 100.0 /100 | #11 | Exceptional 9.6% |
| Bolivians | 100.0 /100 | #12 | Exceptional 9.6% |
| Iranians | 100.0 /100 | #13 | Exceptional 9.7% |
| Immigrants | Iran | 100.0 /100 | #14 | Exceptional 9.7% |
| Indians (Asian) | 100.0 /100 | #15 | Exceptional 9.7% |
| Okinawans | 100.0 /100 | #16 | Exceptional 9.8% |
| Immigrants | Korea | 100.0 /100 | #17 | Exceptional 9.8% |
| Immigrants | Pakistan | 100.0 /100 | #18 | Exceptional 9.8% |
| Immigrants | Sri Lanka | 100.0 /100 | #19 | Exceptional 10.0% |