Immigrants from South Eastern Asia vs Immigrants from Australia Family Households
COMPARE
Immigrants from South Eastern Asia
Immigrants from Australia
Family Households
Family Households Comparison
Immigrants from South Eastern Asia
Immigrants from Australia
67.5%
FAMILY HOUSEHOLDS
100.0/ 100
METRIC RATING
24th/ 347
METRIC RANK
61.3%
FAMILY HOUSEHOLDS
0.0/ 100
METRIC RATING
330th/ 347
METRIC RANK
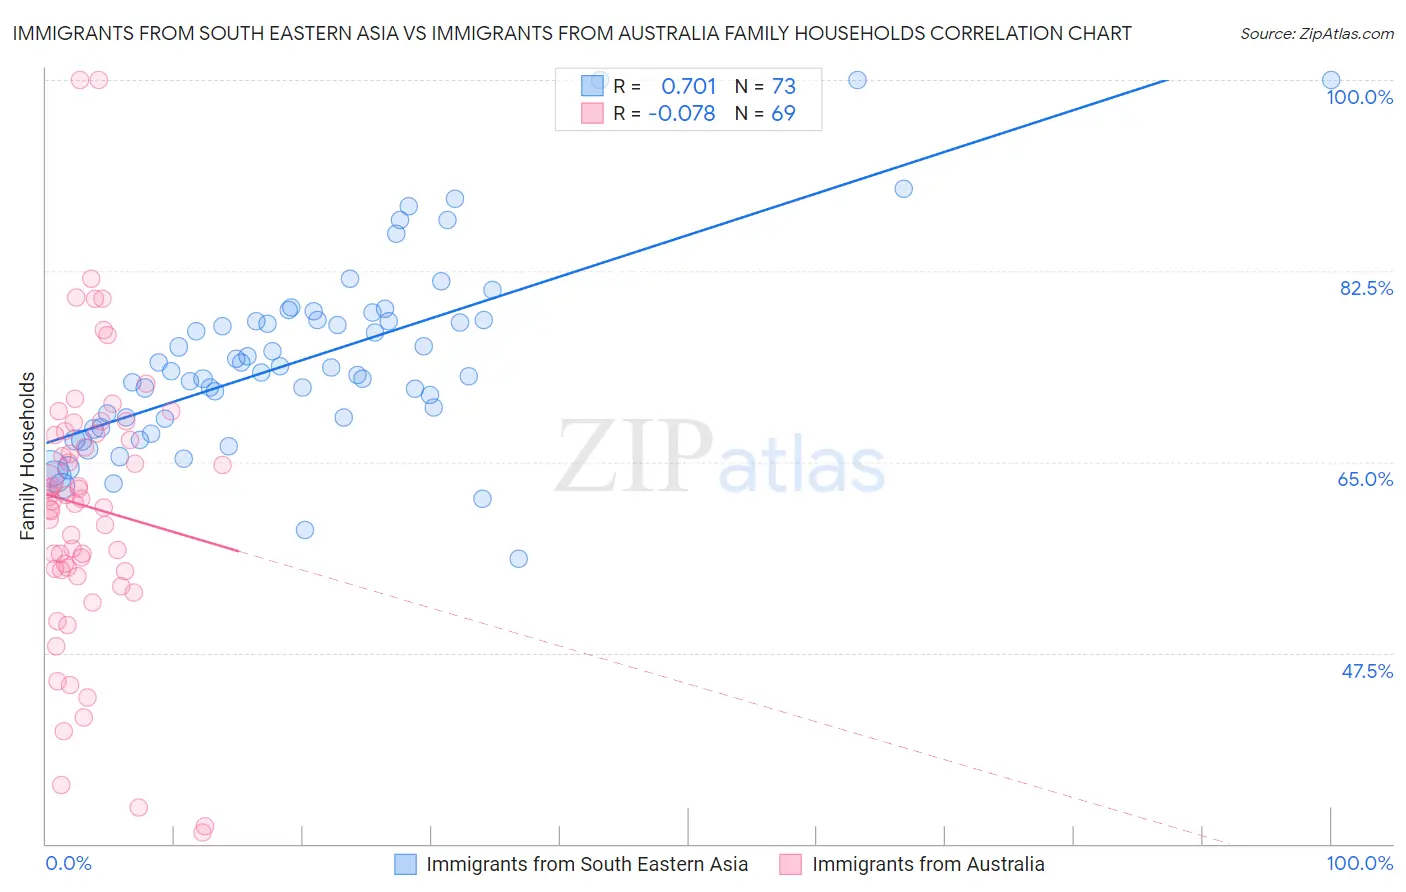
Immigrants from South Eastern Asia vs Immigrants from Australia Family Households Correlation Chart
The statistical analysis conducted on geographies consisting of 512,232,151 people shows a strong positive correlation between the proportion of Immigrants from South Eastern Asia and percentage of family households in the United States with a correlation coefficient (R) of 0.701 and weighted average of 67.5%. Similarly, the statistical analysis conducted on geographies consisting of 227,146,773 people shows a slight negative correlation between the proportion of Immigrants from Australia and percentage of family households in the United States with a correlation coefficient (R) of -0.078 and weighted average of 61.3%, a difference of 10.1%.
Family Households Correlation Summary
| Measurement | Immigrants from South Eastern Asia | Immigrants from Australia |
| Minimum | 56.2% | 31.0% |
| Maximum | 100.0% | 100.0% |
| Range | 43.8% | 69.0% |
| Mean | 74.5% | 60.9% |
| Median | 73.4% | 61.3% |
| Interquartile 25% (IQ1) | 68.5% | 55.1% |
| Interquartile 75% (IQ3) | 78.0% | 67.6% |
| Interquartile Range (IQR) | 9.4% | 12.6% |
| Standard Deviation (Sample) | 8.8% | 13.1% |
| Standard Deviation (Population) | 8.7% | 13.1% |
Similar Demographics by Family Households
Demographics Similar to Immigrants from South Eastern Asia by Family Households
In terms of family households, the demographic groups most similar to Immigrants from South Eastern Asia are Immigrants from Nicaragua (67.5%, a difference of 0.020%), Immigrants from India (67.4%, a difference of 0.040%), Hispanic or Latino (67.4%, a difference of 0.080%), Hawaiian (67.4%, a difference of 0.090%), and Nicaraguan (67.4%, a difference of 0.16%).
| Demographics | Rating | Rank | Family Households |
| Chinese | 100.0 /100 | #17 | Exceptional 68.1% |
| Immigrants | Taiwan | 100.0 /100 | #18 | Exceptional 68.0% |
| Samoans | 100.0 /100 | #19 | Exceptional 67.9% |
| Inupiat | 100.0 /100 | #20 | Exceptional 67.8% |
| Cubans | 100.0 /100 | #21 | Exceptional 67.7% |
| Sri Lankans | 100.0 /100 | #22 | Exceptional 67.7% |
| Immigrants | Pakistan | 100.0 /100 | #23 | Exceptional 67.7% |
| Immigrants | South Eastern Asia | 100.0 /100 | #24 | Exceptional 67.5% |
| Immigrants | Nicaragua | 100.0 /100 | #25 | Exceptional 67.5% |
| Immigrants | India | 100.0 /100 | #26 | Exceptional 67.4% |
| Hispanics or Latinos | 100.0 /100 | #27 | Exceptional 67.4% |
| Hawaiians | 100.0 /100 | #28 | Exceptional 67.4% |
| Nicaraguans | 100.0 /100 | #29 | Exceptional 67.4% |
| Immigrants | Peru | 100.0 /100 | #30 | Exceptional 67.2% |
| Immigrants | Latin America | 100.0 /100 | #31 | Exceptional 67.2% |
Demographics Similar to Immigrants from Australia by Family Households
In terms of family households, the demographic groups most similar to Immigrants from Australia are Immigrants from France (61.3%, a difference of 0.0%), Ethiopian (61.2%, a difference of 0.080%), Cambodian (61.4%, a difference of 0.14%), Kiowa (61.4%, a difference of 0.16%), and Immigrants from Ethiopia (61.2%, a difference of 0.16%).
| Demographics | Rating | Rank | Family Households |
| Tlingit-Haida | 0.0 /100 | #323 | Tragic 61.6% |
| Immigrants | West Indies | 0.0 /100 | #324 | Tragic 61.6% |
| Immigrants | Switzerland | 0.0 /100 | #325 | Tragic 61.6% |
| Indonesians | 0.0 /100 | #326 | Tragic 61.5% |
| Blacks/African Americans | 0.0 /100 | #327 | Tragic 61.5% |
| Kiowa | 0.0 /100 | #328 | Tragic 61.4% |
| Cambodians | 0.0 /100 | #329 | Tragic 61.4% |
| Immigrants | Australia | 0.0 /100 | #330 | Tragic 61.3% |
| Immigrants | France | 0.0 /100 | #331 | Tragic 61.3% |
| Ethiopians | 0.0 /100 | #332 | Tragic 61.2% |
| Immigrants | Ethiopia | 0.0 /100 | #333 | Tragic 61.2% |
| Immigrants | Eastern Africa | 0.0 /100 | #334 | Tragic 61.1% |
| Carpatho Rusyns | 0.0 /100 | #335 | Tragic 61.1% |
| German Russians | 0.0 /100 | #336 | Tragic 60.9% |
| Soviet Union | 0.0 /100 | #337 | Tragic 60.9% |