Immigrants from South Central Asia vs Mexican Male Disability
COMPARE
Immigrants from South Central Asia
Mexican
Male Disability
Male Disability Comparison
Immigrants from South Central Asia
Mexicans
9.4%
MALE DISABILITY
100.0/ 100
METRIC RATING
6th/ 347
METRIC RANK
11.8%
MALE DISABILITY
1.7/ 100
METRIC RATING
233rd/ 347
METRIC RANK
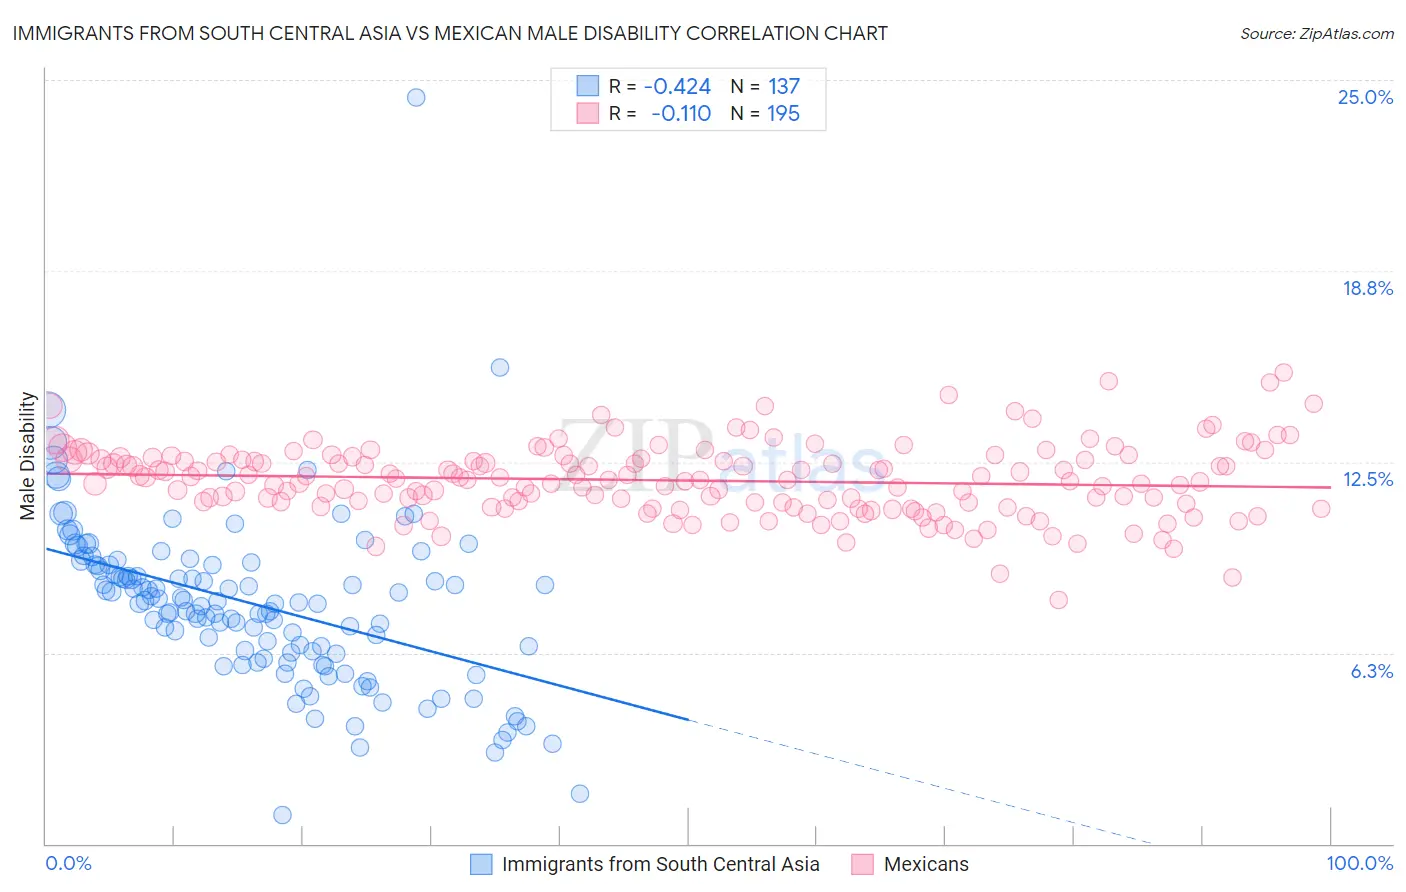
Immigrants from South Central Asia vs Mexican Male Disability Correlation Chart
The statistical analysis conducted on geographies consisting of 473,016,937 people shows a moderate negative correlation between the proportion of Immigrants from South Central Asia and percentage of males with a disability in the United States with a correlation coefficient (R) of -0.424 and weighted average of 9.4%. Similarly, the statistical analysis conducted on geographies consisting of 564,830,995 people shows a poor negative correlation between the proportion of Mexicans and percentage of males with a disability in the United States with a correlation coefficient (R) of -0.110 and weighted average of 11.8%, a difference of 25.6%.
Male Disability Correlation Summary
| Measurement | Immigrants from South Central Asia | Mexican |
| Minimum | 0.93% | 8.0% |
| Maximum | 24.4% | 15.4% |
| Range | 23.5% | 7.4% |
| Mean | 7.8% | 11.9% |
| Median | 7.9% | 11.9% |
| Interquartile 25% (IQ1) | 6.2% | 11.1% |
| Interquartile 75% (IQ3) | 9.1% | 12.6% |
| Interquartile Range (IQR) | 2.9% | 1.5% |
| Standard Deviation (Sample) | 2.8% | 1.2% |
| Standard Deviation (Population) | 2.8% | 1.2% |
Similar Demographics by Male Disability
Demographics Similar to Immigrants from South Central Asia by Male Disability
In terms of male disability, the demographic groups most similar to Immigrants from South Central Asia are Immigrants from Hong Kong (9.4%, a difference of 0.060%), Immigrants from Bolivia (9.5%, a difference of 0.33%), Immigrants from China (9.5%, a difference of 0.93%), Immigrants from Singapore (9.5%, a difference of 1.0%), and Immigrants from Israel (9.6%, a difference of 1.4%).
| Demographics | Rating | Rank | Male Disability |
| Immigrants | India | 100.0 /100 | #1 | Exceptional 9.0% |
| Immigrants | Taiwan | 100.0 /100 | #2 | Exceptional 9.1% |
| Filipinos | 100.0 /100 | #3 | Exceptional 9.1% |
| Thais | 100.0 /100 | #4 | Exceptional 9.2% |
| Immigrants | Hong Kong | 100.0 /100 | #5 | Exceptional 9.4% |
| Immigrants | South Central Asia | 100.0 /100 | #6 | Exceptional 9.4% |
| Immigrants | Bolivia | 100.0 /100 | #7 | Exceptional 9.5% |
| Immigrants | China | 100.0 /100 | #8 | Exceptional 9.5% |
| Immigrants | Singapore | 100.0 /100 | #9 | Exceptional 9.5% |
| Immigrants | Israel | 100.0 /100 | #10 | Exceptional 9.6% |
| Immigrants | Eastern Asia | 100.0 /100 | #11 | Exceptional 9.6% |
| Bolivians | 100.0 /100 | #12 | Exceptional 9.6% |
| Iranians | 100.0 /100 | #13 | Exceptional 9.7% |
| Immigrants | Iran | 100.0 /100 | #14 | Exceptional 9.7% |
| Indians (Asian) | 100.0 /100 | #15 | Exceptional 9.7% |
Demographics Similar to Mexicans by Male Disability
In terms of male disability, the demographic groups most similar to Mexicans are Malaysian (11.8%, a difference of 0.040%), Immigrants from Canada (11.9%, a difference of 0.070%), Dominican (11.8%, a difference of 0.10%), Immigrants from North America (11.9%, a difference of 0.20%), and Croatian (11.8%, a difference of 0.30%).
| Demographics | Rating | Rank | Male Disability |
| Sub-Saharan Africans | 2.8 /100 | #226 | Tragic 11.8% |
| Austrians | 2.5 /100 | #227 | Tragic 11.8% |
| Hispanics or Latinos | 2.3 /100 | #228 | Tragic 11.8% |
| Bermudans | 2.3 /100 | #229 | Tragic 11.8% |
| Croatians | 2.1 /100 | #230 | Tragic 11.8% |
| Dominicans | 1.8 /100 | #231 | Tragic 11.8% |
| Malaysians | 1.8 /100 | #232 | Tragic 11.8% |
| Mexicans | 1.7 /100 | #233 | Tragic 11.8% |
| Immigrants | Canada | 1.6 /100 | #234 | Tragic 11.9% |
| Immigrants | North America | 1.5 /100 | #235 | Tragic 11.9% |
| U.S. Virgin Islanders | 1.3 /100 | #236 | Tragic 11.9% |
| Carpatho Rusyns | 1.3 /100 | #237 | Tragic 11.9% |
| Yugoslavians | 1.2 /100 | #238 | Tragic 11.9% |
| Italians | 1.2 /100 | #239 | Tragic 11.9% |
| Czechs | 1.1 /100 | #240 | Tragic 11.9% |