Immigrants from South Central Asia vs Immigrants from Ukraine Ambulatory Disability
COMPARE
Immigrants from South Central Asia
Immigrants from Ukraine
Ambulatory Disability
Ambulatory Disability Comparison
Immigrants from South Central Asia
Immigrants from Ukraine
5.1%
AMBULATORY DISABILITY
100.0/ 100
METRIC RATING
8th/ 347
METRIC RANK
6.2%
AMBULATORY DISABILITY
18.4/ 100
METRIC RATING
203rd/ 347
METRIC RANK
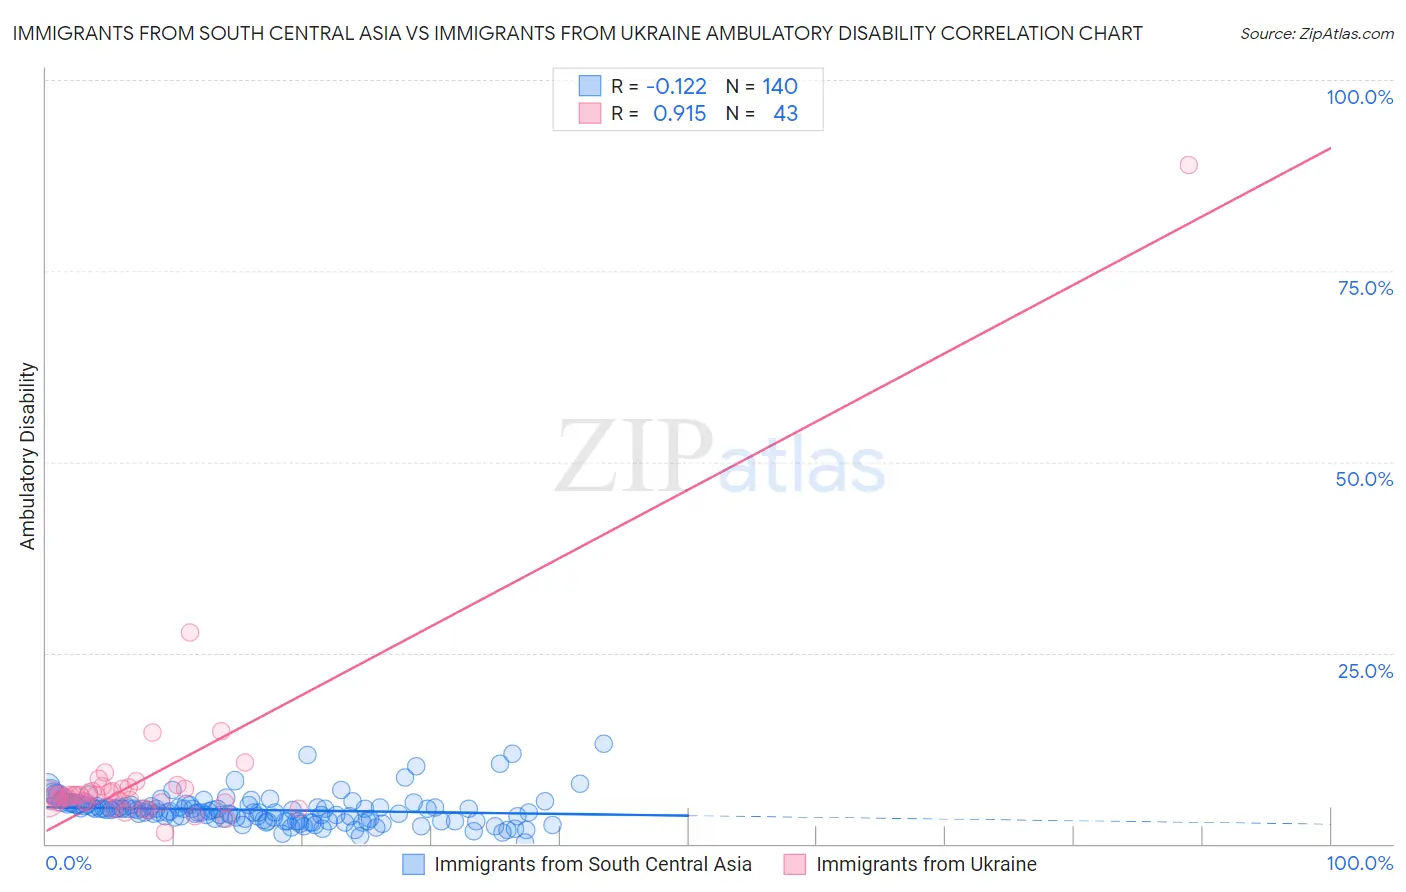
Immigrants from South Central Asia vs Immigrants from Ukraine Ambulatory Disability Correlation Chart
The statistical analysis conducted on geographies consisting of 472,870,749 people shows a poor negative correlation between the proportion of Immigrants from South Central Asia and percentage of population with ambulatory disability in the United States with a correlation coefficient (R) of -0.122 and weighted average of 5.1%. Similarly, the statistical analysis conducted on geographies consisting of 289,659,329 people shows a near-perfect positive correlation between the proportion of Immigrants from Ukraine and percentage of population with ambulatory disability in the United States with a correlation coefficient (R) of 0.915 and weighted average of 6.2%, a difference of 22.1%.
Ambulatory Disability Correlation Summary
| Measurement | Immigrants from South Central Asia | Immigrants from Ukraine |
| Minimum | 0.18% | 1.5% |
| Maximum | 13.0% | 88.9% |
| Range | 12.9% | 87.4% |
| Mean | 4.4% | 8.9% |
| Median | 4.4% | 6.3% |
| Interquartile 25% (IQ1) | 3.0% | 5.5% |
| Interquartile 75% (IQ3) | 5.0% | 7.3% |
| Interquartile Range (IQR) | 2.0% | 1.9% |
| Standard Deviation (Sample) | 2.0% | 13.1% |
| Standard Deviation (Population) | 2.0% | 13.0% |
Similar Demographics by Ambulatory Disability
Demographics Similar to Immigrants from South Central Asia by Ambulatory Disability
In terms of ambulatory disability, the demographic groups most similar to Immigrants from South Central Asia are Iranian (5.1%, a difference of 0.36%), Yup'ik (5.2%, a difference of 0.97%), Bolivian (5.1%, a difference of 0.99%), Immigrants from Bolivia (5.0%, a difference of 1.4%), and Immigrants from Singapore (5.0%, a difference of 2.1%).
| Demographics | Rating | Rank | Ambulatory Disability |
| Immigrants | India | 100.0 /100 | #1 | Exceptional 4.8% |
| Filipinos | 100.0 /100 | #2 | Exceptional 4.9% |
| Thais | 100.0 /100 | #3 | Exceptional 4.9% |
| Immigrants | Taiwan | 100.0 /100 | #4 | Exceptional 4.9% |
| Immigrants | Singapore | 100.0 /100 | #5 | Exceptional 5.0% |
| Immigrants | Bolivia | 100.0 /100 | #6 | Exceptional 5.0% |
| Bolivians | 100.0 /100 | #7 | Exceptional 5.1% |
| Immigrants | South Central Asia | 100.0 /100 | #8 | Exceptional 5.1% |
| Iranians | 100.0 /100 | #9 | Exceptional 5.1% |
| Yup'ik | 100.0 /100 | #10 | Exceptional 5.2% |
| Immigrants | Korea | 100.0 /100 | #11 | Exceptional 5.2% |
| Okinawans | 100.0 /100 | #12 | Exceptional 5.3% |
| Burmese | 100.0 /100 | #13 | Exceptional 5.3% |
| Immigrants | Eastern Asia | 100.0 /100 | #14 | Exceptional 5.3% |
| Immigrants | China | 100.0 /100 | #15 | Exceptional 5.3% |
Demographics Similar to Immigrants from Ukraine by Ambulatory Disability
In terms of ambulatory disability, the demographic groups most similar to Immigrants from Ukraine are Immigrants from Congo (6.2%, a difference of 0.010%), Slovene (6.2%, a difference of 0.030%), Finnish (6.2%, a difference of 0.10%), Albanian (6.2%, a difference of 0.11%), and Immigrants from Central America (6.2%, a difference of 0.14%).
| Demographics | Rating | Rank | Ambulatory Disability |
| Malaysians | 28.2 /100 | #196 | Fair 6.2% |
| Poles | 26.3 /100 | #197 | Fair 6.2% |
| Immigrants | Bangladesh | 24.6 /100 | #198 | Fair 6.2% |
| Italians | 22.6 /100 | #199 | Fair 6.2% |
| Immigrants | Cambodia | 21.5 /100 | #200 | Fair 6.2% |
| Immigrants | Central America | 20.1 /100 | #201 | Fair 6.2% |
| Albanians | 19.7 /100 | #202 | Poor 6.2% |
| Immigrants | Ukraine | 18.4 /100 | #203 | Poor 6.2% |
| Immigrants | Congo | 18.2 /100 | #204 | Poor 6.2% |
| Slovenes | 18.0 /100 | #205 | Poor 6.2% |
| Finns | 17.2 /100 | #206 | Poor 6.2% |
| Alsatians | 15.1 /100 | #207 | Poor 6.3% |
| Bangladeshis | 14.2 /100 | #208 | Poor 6.3% |
| Immigrants | Iraq | 14.0 /100 | #209 | Poor 6.3% |
| Immigrants | Laos | 13.2 /100 | #210 | Poor 6.3% |