Immigrants from South America vs Apache Self-Care Disability
COMPARE
Immigrants from South America
Apache
Self-Care Disability
Self-Care Disability Comparison
Immigrants from South America
Apache
2.4%
SELF-CARE DISABILITY
88.8/ 100
METRIC RATING
132nd/ 347
METRIC RANK
2.7%
SELF-CARE DISABILITY
0.0/ 100
METRIC RATING
282nd/ 347
METRIC RANK
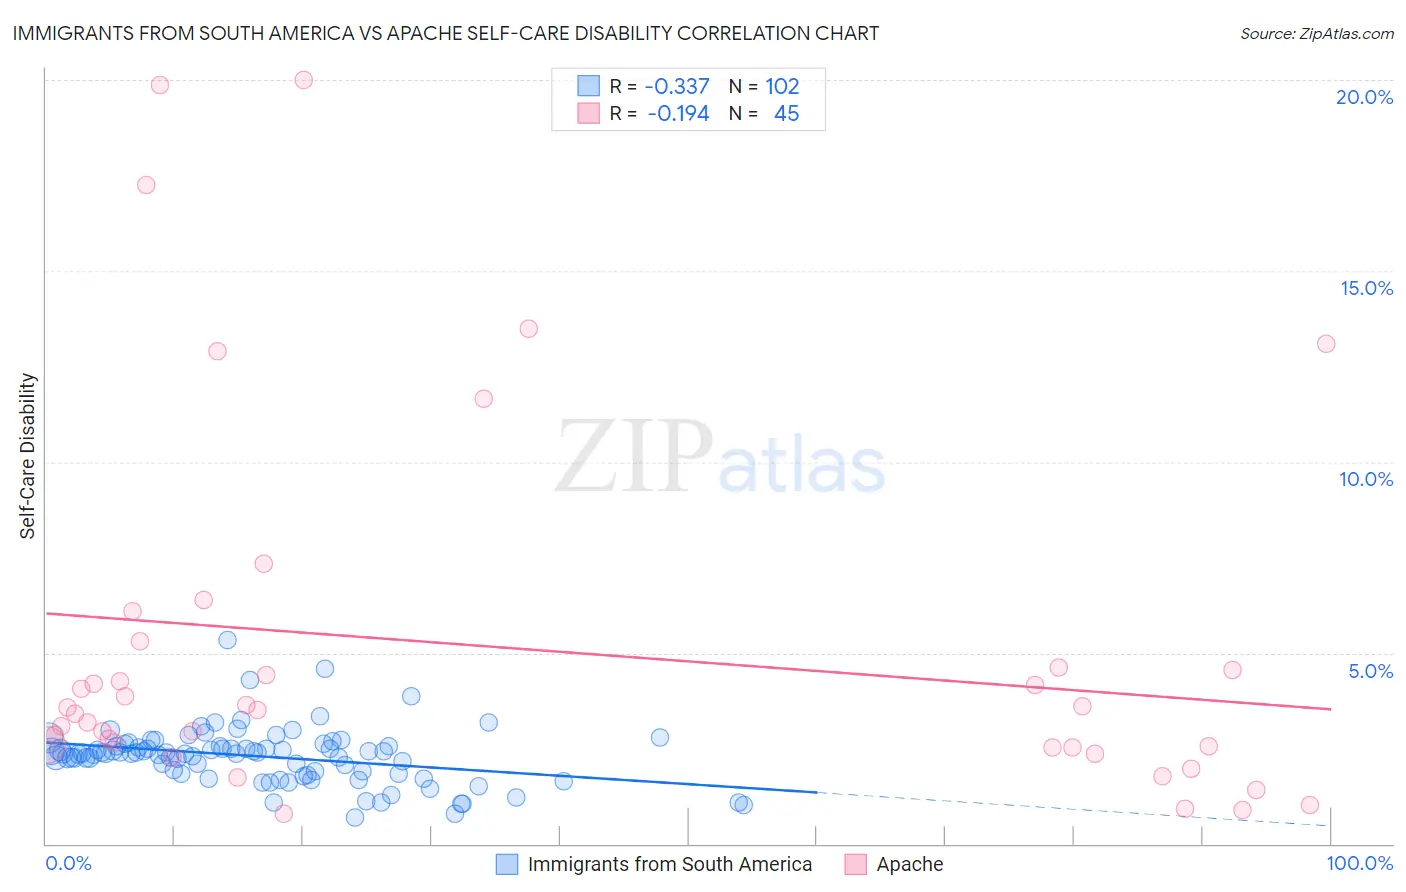
Immigrants from South America vs Apache Self-Care Disability Correlation Chart
The statistical analysis conducted on geographies consisting of 485,509,375 people shows a mild negative correlation between the proportion of Immigrants from South America and percentage of population with self-care disability in the United States with a correlation coefficient (R) of -0.337 and weighted average of 2.4%. Similarly, the statistical analysis conducted on geographies consisting of 230,868,082 people shows a poor negative correlation between the proportion of Apache and percentage of population with self-care disability in the United States with a correlation coefficient (R) of -0.194 and weighted average of 2.7%, a difference of 11.9%.
Self-Care Disability Correlation Summary
| Measurement | Immigrants from South America | Apache |
| Minimum | 0.67% | 0.78% |
| Maximum | 5.3% | 20.0% |
| Range | 4.7% | 19.2% |
| Mean | 2.3% | 5.1% |
| Median | 2.4% | 3.5% |
| Interquartile 25% (IQ1) | 1.8% | 2.5% |
| Interquartile 75% (IQ3) | 2.5% | 5.0% |
| Interquartile Range (IQR) | 0.70% | 2.4% |
| Standard Deviation (Sample) | 0.73% | 4.9% |
| Standard Deviation (Population) | 0.73% | 4.8% |
Similar Demographics by Self-Care Disability
Demographics Similar to Immigrants from South America by Self-Care Disability
In terms of self-care disability, the demographic groups most similar to Immigrants from South America are Polish (2.4%, a difference of 0.010%), Immigrants from Austria (2.4%, a difference of 0.030%), Immigrants from Colombia (2.4%, a difference of 0.030%), Immigrants from Romania (2.4%, a difference of 0.050%), and Russian (2.4%, a difference of 0.070%).
| Demographics | Rating | Rank | Self-Care Disability |
| Hmong | 89.9 /100 | #126 | Excellent 2.4% |
| Colombians | 89.7 /100 | #127 | Excellent 2.4% |
| Immigrants | Hungary | 89.6 /100 | #128 | Excellent 2.4% |
| Immigrants | Romania | 89.3 /100 | #129 | Excellent 2.4% |
| Immigrants | Austria | 89.0 /100 | #130 | Excellent 2.4% |
| Poles | 88.9 /100 | #131 | Excellent 2.4% |
| Immigrants | South America | 88.8 /100 | #132 | Excellent 2.4% |
| Immigrants | Colombia | 88.5 /100 | #133 | Excellent 2.4% |
| Russians | 88.2 /100 | #134 | Excellent 2.4% |
| Laotians | 87.8 /100 | #135 | Excellent 2.4% |
| South American Indians | 87.2 /100 | #136 | Excellent 2.4% |
| Austrians | 87.0 /100 | #137 | Excellent 2.4% |
| Immigrants | Croatia | 86.6 /100 | #138 | Excellent 2.4% |
| Sri Lankans | 86.6 /100 | #139 | Excellent 2.4% |
Demographics Similar to Apache by Self-Care Disability
In terms of self-care disability, the demographic groups most similar to Apache are Immigrants from Iraq (2.7%, a difference of 0.020%), Delaware (2.7%, a difference of 0.070%), Fijian (2.7%, a difference of 0.12%), Jamaican (2.7%, a difference of 0.16%), and Hispanic or Latino (2.7%, a difference of 0.17%).
| Demographics | Rating | Rank | Self-Care Disability |
| Immigrants | Trinidad and Tobago | 0.1 /100 | #275 | Tragic 2.7% |
| Japanese | 0.1 /100 | #276 | Tragic 2.7% |
| Immigrants | Ukraine | 0.1 /100 | #277 | Tragic 2.7% |
| Ottawa | 0.1 /100 | #278 | Tragic 2.7% |
| Iroquois | 0.1 /100 | #279 | Tragic 2.7% |
| Hispanics or Latinos | 0.1 /100 | #280 | Tragic 2.7% |
| Immigrants | Iraq | 0.0 /100 | #281 | Tragic 2.7% |
| Apache | 0.0 /100 | #282 | Tragic 2.7% |
| Delaware | 0.0 /100 | #283 | Tragic 2.7% |
| Fijians | 0.0 /100 | #284 | Tragic 2.7% |
| Jamaicans | 0.0 /100 | #285 | Tragic 2.7% |
| French American Indians | 0.0 /100 | #286 | Tragic 2.7% |
| Immigrants | Jamaica | 0.0 /100 | #287 | Tragic 2.7% |
| Immigrants | Barbados | 0.0 /100 | #288 | Tragic 2.7% |
| Africans | 0.0 /100 | #289 | Tragic 2.7% |