Immigrants from South America vs Immigrants from Serbia Self-Care Disability
COMPARE
Immigrants from South America
Immigrants from Serbia
Self-Care Disability
Self-Care Disability Comparison
Immigrants from South America
Immigrants from Serbia
2.4%
SELF-CARE DISABILITY
88.8/ 100
METRIC RATING
132nd/ 347
METRIC RANK
2.3%
SELF-CARE DISABILITY
99.6/ 100
METRIC RATING
52nd/ 347
METRIC RANK
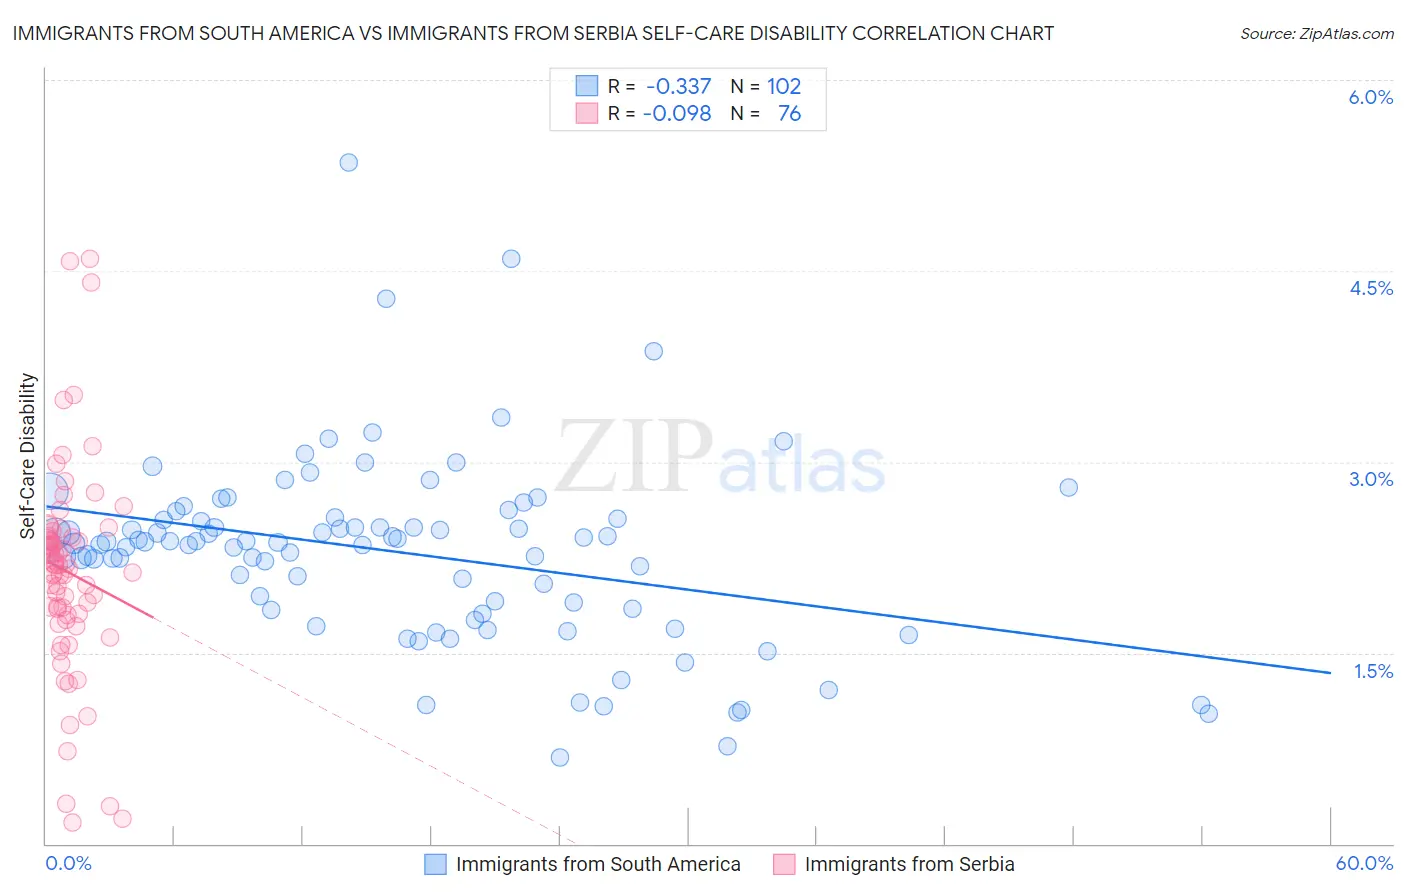
Immigrants from South America vs Immigrants from Serbia Self-Care Disability Correlation Chart
The statistical analysis conducted on geographies consisting of 485,509,375 people shows a mild negative correlation between the proportion of Immigrants from South America and percentage of population with self-care disability in the United States with a correlation coefficient (R) of -0.337 and weighted average of 2.4%. Similarly, the statistical analysis conducted on geographies consisting of 131,686,608 people shows a slight negative correlation between the proportion of Immigrants from Serbia and percentage of population with self-care disability in the United States with a correlation coefficient (R) of -0.098 and weighted average of 2.3%, a difference of 4.5%.
Self-Care Disability Correlation Summary
| Measurement | Immigrants from South America | Immigrants from Serbia |
| Minimum | 0.67% | 0.16% |
| Maximum | 5.3% | 4.6% |
| Range | 4.7% | 4.4% |
| Mean | 2.3% | 2.1% |
| Median | 2.4% | 2.2% |
| Interquartile 25% (IQ1) | 1.8% | 1.8% |
| Interquartile 75% (IQ3) | 2.5% | 2.4% |
| Interquartile Range (IQR) | 0.70% | 0.61% |
| Standard Deviation (Sample) | 0.73% | 0.82% |
| Standard Deviation (Population) | 0.73% | 0.82% |
Similar Demographics by Self-Care Disability
Demographics Similar to Immigrants from South America by Self-Care Disability
In terms of self-care disability, the demographic groups most similar to Immigrants from South America are Polish (2.4%, a difference of 0.010%), Immigrants from Austria (2.4%, a difference of 0.030%), Immigrants from Colombia (2.4%, a difference of 0.030%), Immigrants from Romania (2.4%, a difference of 0.050%), and Russian (2.4%, a difference of 0.070%).
| Demographics | Rating | Rank | Self-Care Disability |
| Hmong | 89.9 /100 | #126 | Excellent 2.4% |
| Colombians | 89.7 /100 | #127 | Excellent 2.4% |
| Immigrants | Hungary | 89.6 /100 | #128 | Excellent 2.4% |
| Immigrants | Romania | 89.3 /100 | #129 | Excellent 2.4% |
| Immigrants | Austria | 89.0 /100 | #130 | Excellent 2.4% |
| Poles | 88.9 /100 | #131 | Excellent 2.4% |
| Immigrants | South America | 88.8 /100 | #132 | Excellent 2.4% |
| Immigrants | Colombia | 88.5 /100 | #133 | Excellent 2.4% |
| Russians | 88.2 /100 | #134 | Excellent 2.4% |
| Laotians | 87.8 /100 | #135 | Excellent 2.4% |
| South American Indians | 87.2 /100 | #136 | Excellent 2.4% |
| Austrians | 87.0 /100 | #137 | Excellent 2.4% |
| Immigrants | Croatia | 86.6 /100 | #138 | Excellent 2.4% |
| Sri Lankans | 86.6 /100 | #139 | Excellent 2.4% |
Demographics Similar to Immigrants from Serbia by Self-Care Disability
In terms of self-care disability, the demographic groups most similar to Immigrants from Serbia are Kenyan (2.3%, a difference of 0.020%), Australian (2.3%, a difference of 0.030%), Argentinean (2.3%, a difference of 0.080%), Immigrants from France (2.3%, a difference of 0.14%), and Immigrants from Brazil (2.3%, a difference of 0.17%).
| Demographics | Rating | Rank | Self-Care Disability |
| Norwegians | 99.8 /100 | #45 | Exceptional 2.3% |
| Czechs | 99.8 /100 | #46 | Exceptional 2.3% |
| Jordanians | 99.7 /100 | #47 | Exceptional 2.3% |
| Immigrants | Malaysia | 99.7 /100 | #48 | Exceptional 2.3% |
| Latvians | 99.7 /100 | #49 | Exceptional 2.3% |
| Immigrants | Brazil | 99.7 /100 | #50 | Exceptional 2.3% |
| Kenyans | 99.7 /100 | #51 | Exceptional 2.3% |
| Immigrants | Serbia | 99.6 /100 | #52 | Exceptional 2.3% |
| Australians | 99.6 /100 | #53 | Exceptional 2.3% |
| Argentineans | 99.6 /100 | #54 | Exceptional 2.3% |
| Immigrants | France | 99.6 /100 | #55 | Exceptional 2.3% |
| Immigrants | Eastern Asia | 99.6 /100 | #56 | Exceptional 2.3% |
| Immigrants | Belgium | 99.6 /100 | #57 | Exceptional 2.3% |
| Immigrants | Cameroon | 99.6 /100 | #58 | Exceptional 2.3% |
| New Zealanders | 99.5 /100 | #59 | Exceptional 2.3% |