Immigrants from South America vs Jamaican Bachelor's Degree
COMPARE
Immigrants from South America
Jamaican
Bachelor's Degree
Bachelor's Degree Comparison
Immigrants from South America
Jamaicans
38.6%
BACHELOR'S DEGREE
70.1/ 100
METRIC RATING
157th/ 347
METRIC RANK
33.6%
BACHELOR'S DEGREE
1.0/ 100
METRIC RATING
246th/ 347
METRIC RANK
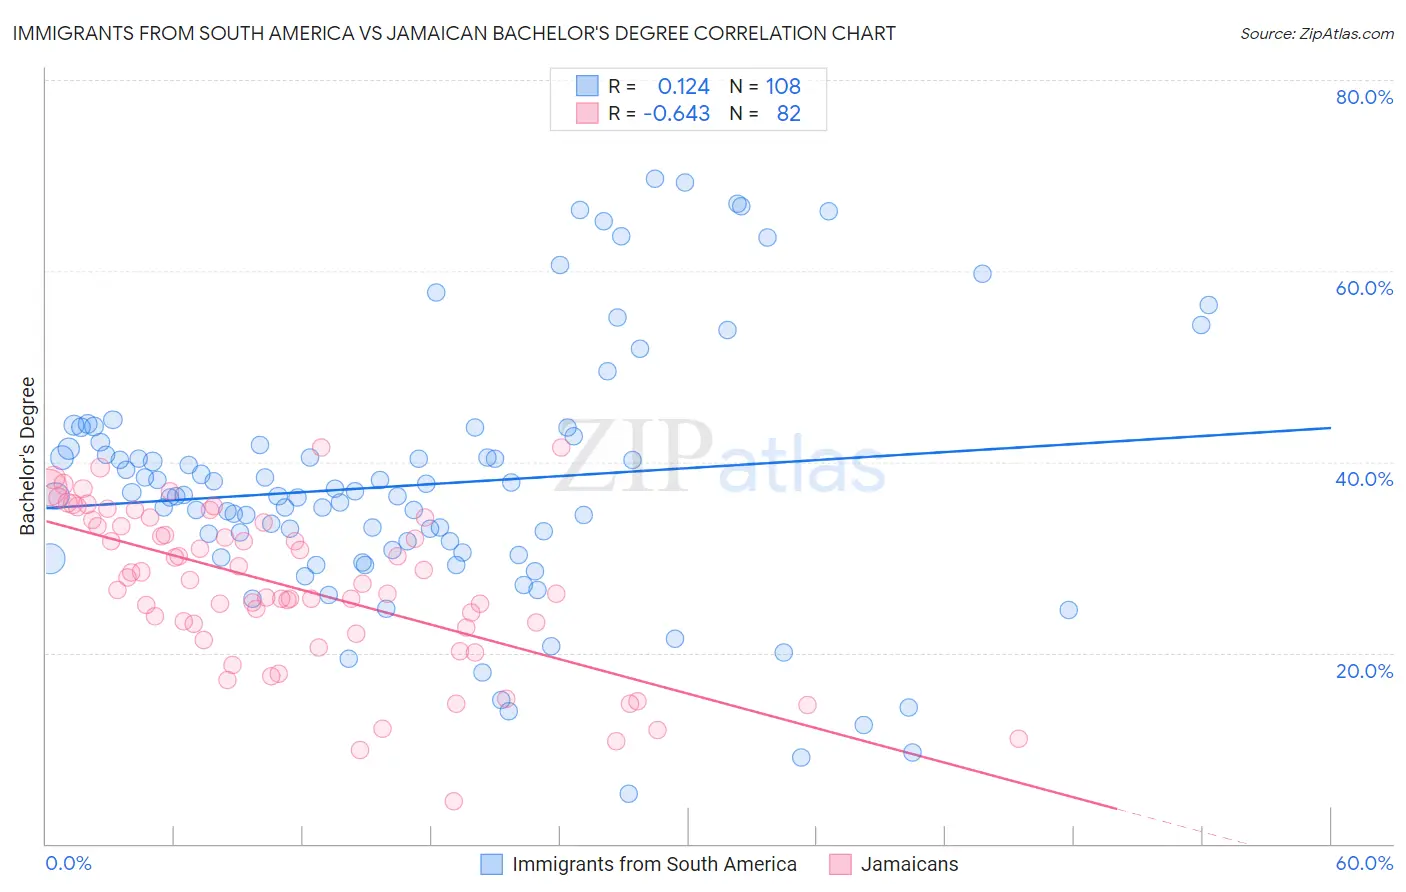
Immigrants from South America vs Jamaican Bachelor's Degree Correlation Chart
The statistical analysis conducted on geographies consisting of 486,368,890 people shows a poor positive correlation between the proportion of Immigrants from South America and percentage of population with at least bachelor's degree education in the United States with a correlation coefficient (R) of 0.124 and weighted average of 38.6%. Similarly, the statistical analysis conducted on geographies consisting of 368,011,400 people shows a significant negative correlation between the proportion of Jamaicans and percentage of population with at least bachelor's degree education in the United States with a correlation coefficient (R) of -0.643 and weighted average of 33.6%, a difference of 14.8%.
Bachelor's Degree Correlation Summary
| Measurement | Immigrants from South America | Jamaican |
| Minimum | 5.3% | 4.5% |
| Maximum | 69.7% | 41.5% |
| Range | 64.4% | 37.0% |
| Mean | 37.6% | 27.0% |
| Median | 36.4% | 27.5% |
| Interquartile 25% (IQ1) | 30.4% | 22.7% |
| Interquartile 75% (IQ3) | 41.9% | 33.7% |
| Interquartile Range (IQR) | 11.5% | 11.0% |
| Standard Deviation (Sample) | 13.4% | 8.2% |
| Standard Deviation (Population) | 13.4% | 8.1% |
Similar Demographics by Bachelor's Degree
Demographics Similar to Immigrants from South America by Bachelor's Degree
In terms of bachelor's degree, the demographic groups most similar to Immigrants from South America are Immigrants from Germany (38.6%, a difference of 0.060%), Kenyan (38.7%, a difference of 0.28%), Chinese (38.5%, a difference of 0.39%), Vietnamese (38.5%, a difference of 0.39%), and Immigrants from Kenya (38.8%, a difference of 0.43%).
| Demographics | Rating | Rank | Bachelor's Degree |
| South Americans | 77.3 /100 | #150 | Good 38.9% |
| Immigrants | Africa | 76.5 /100 | #151 | Good 38.9% |
| Sudanese | 76.4 /100 | #152 | Good 38.9% |
| Slavs | 75.9 /100 | #153 | Good 38.9% |
| Canadians | 75.0 /100 | #154 | Good 38.8% |
| Immigrants | Kenya | 73.8 /100 | #155 | Good 38.8% |
| Kenyans | 72.5 /100 | #156 | Good 38.7% |
| Immigrants | South America | 70.1 /100 | #157 | Good 38.6% |
| Immigrants | Germany | 69.6 /100 | #158 | Good 38.6% |
| Chinese | 66.6 /100 | #159 | Good 38.5% |
| Vietnamese | 66.6 /100 | #160 | Good 38.5% |
| Uruguayans | 65.8 /100 | #161 | Good 38.4% |
| Colombians | 65.0 /100 | #162 | Good 38.4% |
| Peruvians | 63.4 /100 | #163 | Good 38.3% |
| Hungarians | 62.1 /100 | #164 | Good 38.3% |
Demographics Similar to Jamaicans by Bachelor's Degree
In terms of bachelor's degree, the demographic groups most similar to Jamaicans are Immigrants from Congo (33.6%, a difference of 0.090%), Cree (33.6%, a difference of 0.10%), Immigrants from Liberia (33.5%, a difference of 0.23%), Indonesian (33.5%, a difference of 0.24%), and Immigrants from Fiji (33.7%, a difference of 0.36%).
| Demographics | Rating | Rank | Bachelor's Degree |
| British West Indians | 2.5 /100 | #239 | Tragic 34.5% |
| Tongans | 2.0 /100 | #240 | Tragic 34.3% |
| Immigrants | Cambodia | 1.9 /100 | #241 | Tragic 34.2% |
| Immigrants | Nonimmigrants | 1.8 /100 | #242 | Tragic 34.2% |
| Immigrants | Guyana | 1.4 /100 | #243 | Tragic 33.9% |
| Delaware | 1.2 /100 | #244 | Tragic 33.8% |
| Immigrants | Fiji | 1.2 /100 | #245 | Tragic 33.7% |
| Jamaicans | 1.0 /100 | #246 | Tragic 33.6% |
| Immigrants | Congo | 1.0 /100 | #247 | Tragic 33.6% |
| Cree | 1.0 /100 | #248 | Tragic 33.6% |
| Immigrants | Liberia | 0.9 /100 | #249 | Tragic 33.5% |
| Indonesians | 0.9 /100 | #250 | Tragic 33.5% |
| Japanese | 0.7 /100 | #251 | Tragic 33.3% |
| Immigrants | Bahamas | 0.7 /100 | #252 | Tragic 33.3% |
| U.S. Virgin Islanders | 0.7 /100 | #253 | Tragic 33.2% |