Immigrants from Singapore vs Immigrants from Venezuela Disability Age Under 5
COMPARE
Immigrants from Singapore
Immigrants from Venezuela
Disability Age Under 5
Disability Age Under 5 Comparison
Immigrants from Singapore
Immigrants from Venezuela
1.1%
DISABILITY AGE UNDER 5
99.7/ 100
METRIC RATING
48th/ 347
METRIC RANK
1.2%
DISABILITY AGE UNDER 5
93.4/ 100
METRIC RATING
118th/ 347
METRIC RANK
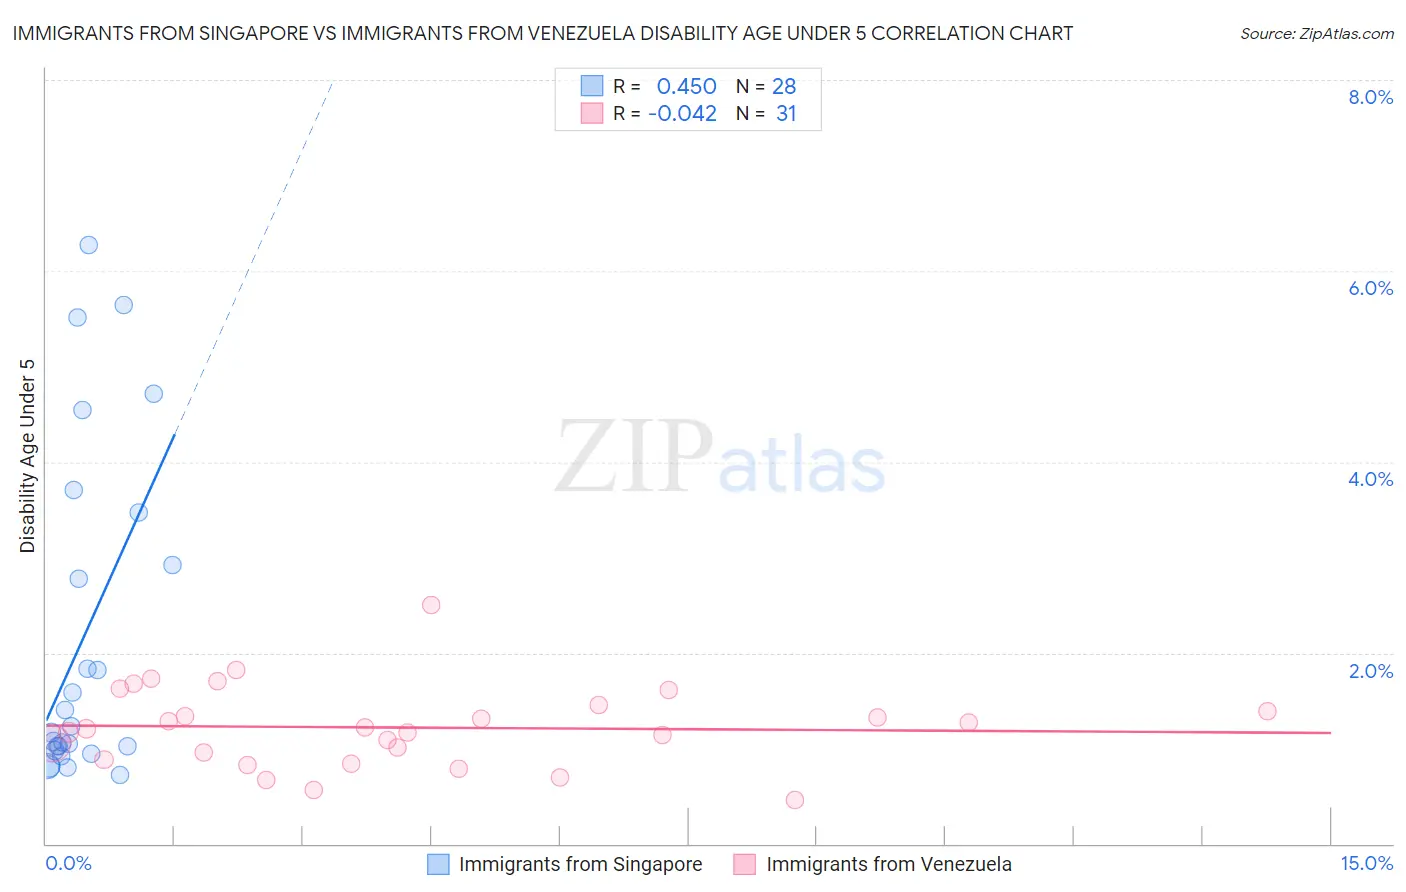
Immigrants from Singapore vs Immigrants from Venezuela Disability Age Under 5 Correlation Chart
The statistical analysis conducted on geographies consisting of 97,565,040 people shows a moderate positive correlation between the proportion of Immigrants from Singapore and percentage of population with a disability under the age of 5 in the United States with a correlation coefficient (R) of 0.450 and weighted average of 1.1%. Similarly, the statistical analysis conducted on geographies consisting of 173,759,637 people shows no correlation between the proportion of Immigrants from Venezuela and percentage of population with a disability under the age of 5 in the United States with a correlation coefficient (R) of -0.042 and weighted average of 1.2%, a difference of 8.7%.
Disability Age Under 5 Correlation Summary
| Measurement | Immigrants from Singapore | Immigrants from Venezuela |
| Minimum | 0.71% | 0.46% |
| Maximum | 6.3% | 2.5% |
| Range | 5.6% | 2.0% |
| Mean | 2.2% | 1.2% |
| Median | 1.2% | 1.2% |
| Interquartile 25% (IQ1) | 1.00% | 0.88% |
| Interquartile 75% (IQ3) | 3.2% | 1.4% |
| Interquartile Range (IQR) | 2.2% | 0.57% |
| Standard Deviation (Sample) | 1.7% | 0.43% |
| Standard Deviation (Population) | 1.7% | 0.42% |
Similar Demographics by Disability Age Under 5
Demographics Similar to Immigrants from Singapore by Disability Age Under 5
In terms of disability age under 5, the demographic groups most similar to Immigrants from Singapore are Immigrants from Russia (1.1%, a difference of 0.21%), Immigrants from Sweden (1.1%, a difference of 0.22%), Immigrants from Japan (1.1%, a difference of 0.22%), Immigrants from Congo (1.1%, a difference of 0.36%), and Immigrants from Kazakhstan (1.1%, a difference of 0.41%).
| Demographics | Rating | Rank | Disability Age Under 5 |
| Thais | 99.8 /100 | #41 | Exceptional 1.1% |
| Immigrants | Bulgaria | 99.8 /100 | #42 | Exceptional 1.1% |
| Pima | 99.8 /100 | #43 | Exceptional 1.1% |
| Immigrants | Asia | 99.8 /100 | #44 | Exceptional 1.1% |
| Immigrants | Turkey | 99.8 /100 | #45 | Exceptional 1.1% |
| Immigrants | Congo | 99.8 /100 | #46 | Exceptional 1.1% |
| Immigrants | Sweden | 99.8 /100 | #47 | Exceptional 1.1% |
| Immigrants | Singapore | 99.7 /100 | #48 | Exceptional 1.1% |
| Immigrants | Russia | 99.7 /100 | #49 | Exceptional 1.1% |
| Immigrants | Japan | 99.7 /100 | #50 | Exceptional 1.1% |
| Immigrants | Kazakhstan | 99.7 /100 | #51 | Exceptional 1.1% |
| Immigrants | Bolivia | 99.6 /100 | #52 | Exceptional 1.1% |
| Asians | 99.6 /100 | #53 | Exceptional 1.1% |
| Immigrants | El Salvador | 99.6 /100 | #54 | Exceptional 1.1% |
| Salvadorans | 99.5 /100 | #55 | Exceptional 1.1% |
Demographics Similar to Immigrants from Venezuela by Disability Age Under 5
In terms of disability age under 5, the demographic groups most similar to Immigrants from Venezuela are Immigrants from Philippines (1.2%, a difference of 0.030%), Immigrants from Northern Africa (1.2%, a difference of 0.17%), Immigrants from Caribbean (1.2%, a difference of 0.19%), Belizean (1.2%, a difference of 0.20%), and Bhutanese (1.2%, a difference of 0.34%).
| Demographics | Rating | Rank | Disability Age Under 5 |
| Senegalese | 94.6 /100 | #111 | Exceptional 1.2% |
| Immigrants | Australia | 94.4 /100 | #112 | Exceptional 1.2% |
| Immigrants | Oceania | 94.2 /100 | #113 | Exceptional 1.2% |
| Belizeans | 93.9 /100 | #114 | Exceptional 1.2% |
| Immigrants | Caribbean | 93.8 /100 | #115 | Exceptional 1.2% |
| Immigrants | Northern Africa | 93.8 /100 | #116 | Exceptional 1.2% |
| Immigrants | Philippines | 93.5 /100 | #117 | Exceptional 1.2% |
| Immigrants | Venezuela | 93.4 /100 | #118 | Exceptional 1.2% |
| Bhutanese | 92.5 /100 | #119 | Exceptional 1.2% |
| Immigrants | Eritrea | 92.3 /100 | #120 | Exceptional 1.2% |
| Immigrants | Senegal | 91.4 /100 | #121 | Exceptional 1.2% |
| Aleuts | 90.7 /100 | #122 | Exceptional 1.2% |
| Zimbabweans | 90.6 /100 | #123 | Exceptional 1.2% |
| Immigrants | Cambodia | 90.5 /100 | #124 | Exceptional 1.2% |
| Japanese | 90.3 /100 | #125 | Exceptional 1.2% |