Immigrants from Singapore vs Guatemalan Unemployment Among Seniors over 75 years
COMPARE
Immigrants from Singapore
Guatemalan
Unemployment Among Seniors over 75 years
Unemployment Among Seniors over 75 years Comparison
Immigrants from Singapore
Guatemalans
8.1%
UNEMPLOYMENT AMONG SENIORS OVER 75 YEARS
99.7/ 100
METRIC RATING
86th/ 347
METRIC RANK
8.8%
UNEMPLOYMENT AMONG SENIORS OVER 75 YEARS
39.5/ 100
METRIC RATING
182nd/ 347
METRIC RANK
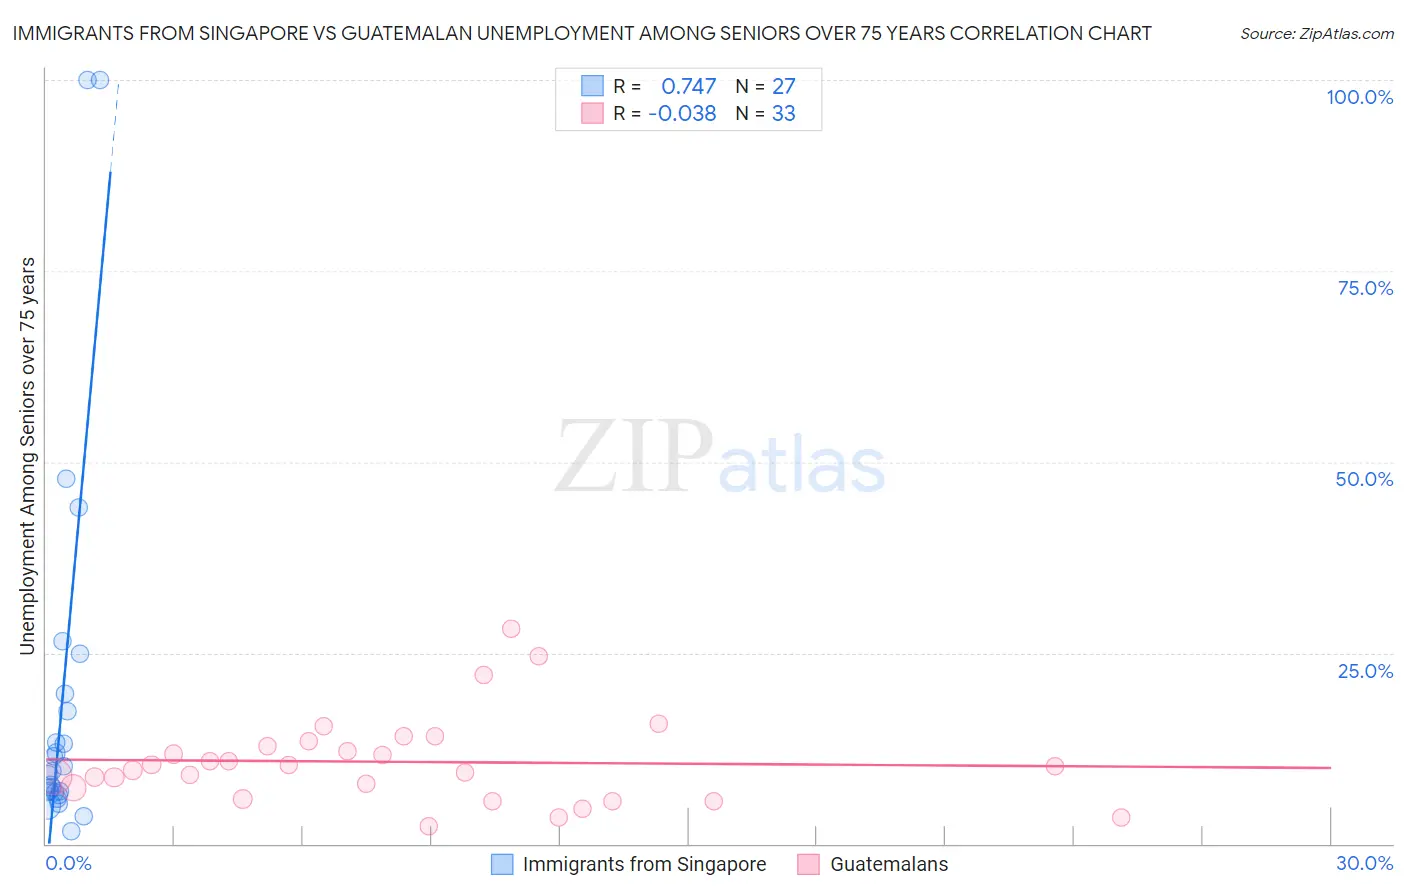
Immigrants from Singapore vs Guatemalan Unemployment Among Seniors over 75 years Correlation Chart
The statistical analysis conducted on geographies consisting of 97,809,221 people shows a strong positive correlation between the proportion of Immigrants from Singapore and unemployment rate among seniors over the age of 75 in the United States with a correlation coefficient (R) of 0.747 and weighted average of 8.1%. Similarly, the statistical analysis conducted on geographies consisting of 204,244,700 people shows no correlation between the proportion of Guatemalans and unemployment rate among seniors over the age of 75 in the United States with a correlation coefficient (R) of -0.038 and weighted average of 8.8%, a difference of 8.9%.
Unemployment Among Seniors over 75 years Correlation Summary
| Measurement | Immigrants from Singapore | Guatemalan |
| Minimum | 1.6% | 2.3% |
| Maximum | 100.0% | 28.2% |
| Range | 98.4% | 25.9% |
| Mean | 19.6% | 10.7% |
| Median | 9.5% | 10.1% |
| Interquartile 25% (IQ1) | 6.8% | 6.6% |
| Interquartile 75% (IQ3) | 19.7% | 13.1% |
| Interquartile Range (IQR) | 12.9% | 6.5% |
| Standard Deviation (Sample) | 25.7% | 5.8% |
| Standard Deviation (Population) | 25.3% | 5.7% |
Similar Demographics by Unemployment Among Seniors over 75 years
Demographics Similar to Immigrants from Singapore by Unemployment Among Seniors over 75 years
In terms of unemployment among seniors over 75 years, the demographic groups most similar to Immigrants from Singapore are Immigrants from Indonesia (8.1%, a difference of 0.090%), U.S. Virgin Islander (8.1%, a difference of 0.15%), Arapaho (8.1%, a difference of 0.24%), Bhutanese (8.0%, a difference of 0.34%), and Cuban (8.0%, a difference of 0.36%).
| Demographics | Rating | Rank | Unemployment Among Seniors over 75 years |
| Immigrants | Japan | 99.7 /100 | #79 | Exceptional 8.0% |
| Immigrants | Australia | 99.7 /100 | #80 | Exceptional 8.0% |
| Cubans | 99.7 /100 | #81 | Exceptional 8.0% |
| Bhutanese | 99.7 /100 | #82 | Exceptional 8.0% |
| Arapaho | 99.7 /100 | #83 | Exceptional 8.1% |
| U.S. Virgin Islanders | 99.7 /100 | #84 | Exceptional 8.1% |
| Immigrants | Indonesia | 99.7 /100 | #85 | Exceptional 8.1% |
| Immigrants | Singapore | 99.7 /100 | #86 | Exceptional 8.1% |
| Basques | 99.5 /100 | #87 | Exceptional 8.1% |
| New Zealanders | 99.5 /100 | #88 | Exceptional 8.1% |
| Immigrants | Korea | 99.5 /100 | #89 | Exceptional 8.1% |
| Immigrants | Vietnam | 99.5 /100 | #90 | Exceptional 8.1% |
| Egyptians | 99.5 /100 | #91 | Exceptional 8.1% |
| Venezuelans | 99.5 /100 | #92 | Exceptional 8.1% |
| Immigrants | Netherlands | 99.5 /100 | #93 | Exceptional 8.1% |
Demographics Similar to Guatemalans by Unemployment Among Seniors over 75 years
In terms of unemployment among seniors over 75 years, the demographic groups most similar to Guatemalans are Immigrants from Thailand (8.8%, a difference of 0.040%), Immigrants from Afghanistan (8.8%, a difference of 0.070%), Immigrants from Italy (8.8%, a difference of 0.12%), Immigrants from Somalia (8.8%, a difference of 0.12%), and West Indian (8.8%, a difference of 0.13%).
| Demographics | Rating | Rank | Unemployment Among Seniors over 75 years |
| Syrians | 49.6 /100 | #175 | Average 8.7% |
| Somalis | 45.3 /100 | #176 | Average 8.8% |
| Central Americans | 43.3 /100 | #177 | Average 8.8% |
| West Indians | 41.9 /100 | #178 | Average 8.8% |
| Immigrants | Italy | 41.7 /100 | #179 | Average 8.8% |
| Immigrants | Somalia | 41.7 /100 | #180 | Average 8.8% |
| Immigrants | Thailand | 40.2 /100 | #181 | Average 8.8% |
| Guatemalans | 39.5 /100 | #182 | Fair 8.8% |
| Immigrants | Afghanistan | 38.2 /100 | #183 | Fair 8.8% |
| Immigrants | Micronesia | 37.2 /100 | #184 | Fair 8.8% |
| Choctaw | 37.1 /100 | #185 | Fair 8.8% |
| Immigrants | Ethiopia | 36.2 /100 | #186 | Fair 8.8% |
| Immigrants | Europe | 35.2 /100 | #187 | Fair 8.8% |
| Immigrants | Eastern Europe | 34.7 /100 | #188 | Fair 8.8% |
| Immigrants | Haiti | 34.7 /100 | #189 | Fair 8.8% |