Immigrants from Sierra Leone vs Ecuadorian Female Disability
COMPARE
Immigrants from Sierra Leone
Ecuadorian
Female Disability
Female Disability Comparison
Immigrants from Sierra Leone
Ecuadorians
11.6%
FEMALE DISABILITY
99.4/ 100
METRIC RATING
93rd/ 347
METRIC RANK
11.9%
FEMALE DISABILITY
93.4/ 100
METRIC RATING
138th/ 347
METRIC RANK
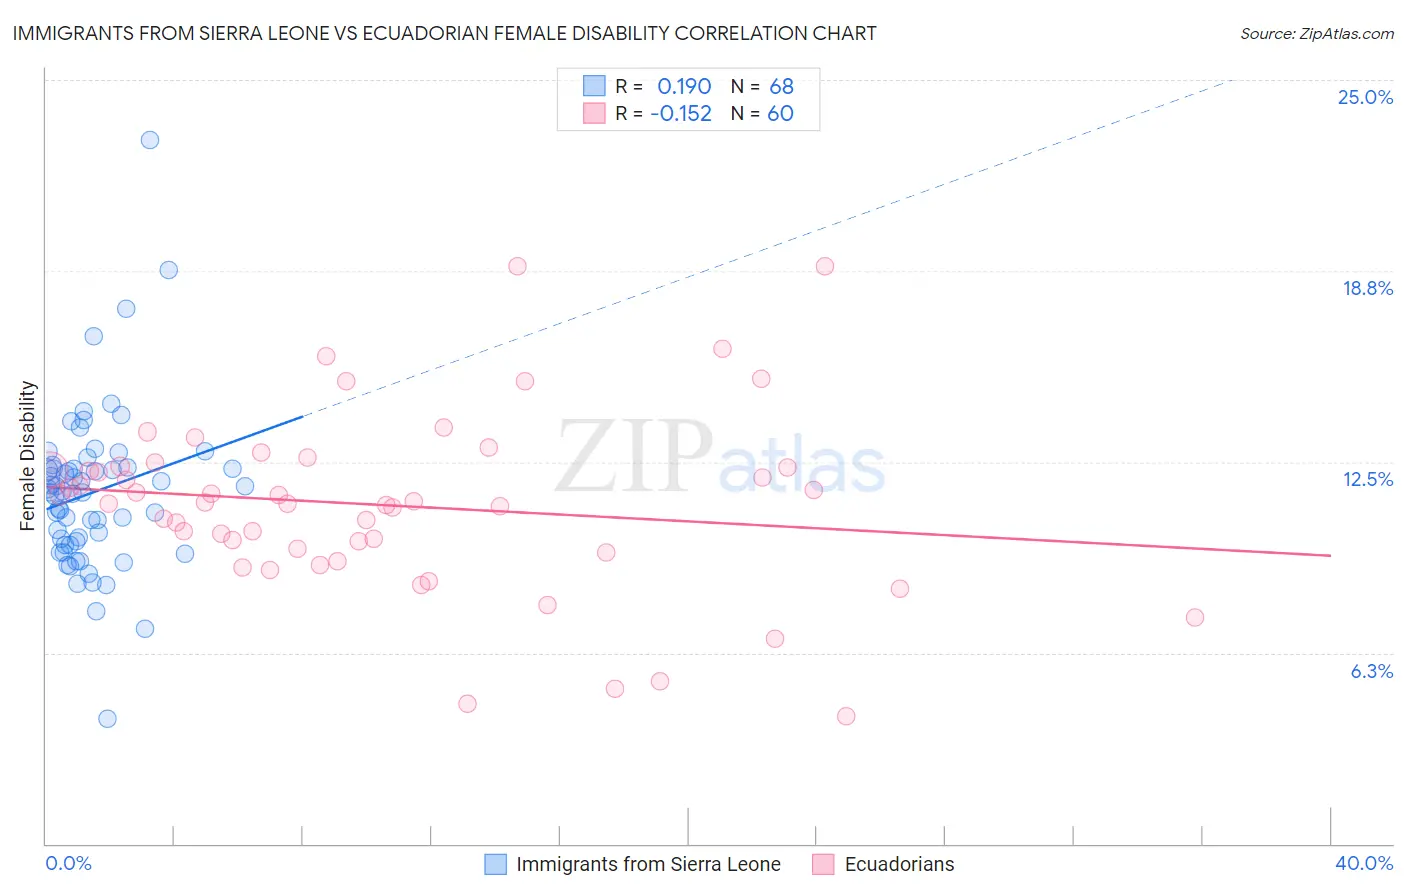
Immigrants from Sierra Leone vs Ecuadorian Female Disability Correlation Chart
The statistical analysis conducted on geographies consisting of 101,646,950 people shows a poor positive correlation between the proportion of Immigrants from Sierra Leone and percentage of females with a disability in the United States with a correlation coefficient (R) of 0.190 and weighted average of 11.6%. Similarly, the statistical analysis conducted on geographies consisting of 317,804,285 people shows a poor negative correlation between the proportion of Ecuadorians and percentage of females with a disability in the United States with a correlation coefficient (R) of -0.152 and weighted average of 11.9%, a difference of 2.5%.
Female Disability Correlation Summary
| Measurement | Immigrants from Sierra Leone | Ecuadorian |
| Minimum | 4.1% | 4.2% |
| Maximum | 23.1% | 18.9% |
| Range | 18.9% | 14.7% |
| Mean | 11.5% | 11.1% |
| Median | 11.5% | 11.2% |
| Interquartile 25% (IQ1) | 9.8% | 9.6% |
| Interquartile 75% (IQ3) | 12.3% | 12.3% |
| Interquartile Range (IQR) | 2.5% | 2.7% |
| Standard Deviation (Sample) | 2.7% | 2.9% |
| Standard Deviation (Population) | 2.7% | 2.9% |
Similar Demographics by Female Disability
Demographics Similar to Immigrants from Sierra Leone by Female Disability
In terms of female disability, the demographic groups most similar to Immigrants from Sierra Leone are Immigrants from Brazil (11.6%, a difference of 0.030%), Immigrants from Czechoslovakia (11.6%, a difference of 0.10%), Immigrants from Northern Europe (11.6%, a difference of 0.10%), Immigrants from Zimbabwe (11.6%, a difference of 0.11%), and Vietnamese (11.6%, a difference of 0.12%).
| Demographics | Rating | Rank | Female Disability |
| Immigrants | Cameroon | 99.6 /100 | #86 | Exceptional 11.6% |
| Immigrants | Denmark | 99.5 /100 | #87 | Exceptional 11.6% |
| Yup'ik | 99.5 /100 | #88 | Exceptional 11.6% |
| Vietnamese | 99.5 /100 | #89 | Exceptional 11.6% |
| Immigrants | Romania | 99.5 /100 | #90 | Exceptional 11.6% |
| Immigrants | Zimbabwe | 99.5 /100 | #91 | Exceptional 11.6% |
| Immigrants | Czechoslovakia | 99.5 /100 | #92 | Exceptional 11.6% |
| Immigrants | Sierra Leone | 99.4 /100 | #93 | Exceptional 11.6% |
| Immigrants | Brazil | 99.4 /100 | #94 | Exceptional 11.6% |
| Immigrants | Northern Europe | 99.4 /100 | #95 | Exceptional 11.6% |
| Immigrants | Russia | 99.0 /100 | #96 | Exceptional 11.7% |
| Koreans | 99.0 /100 | #97 | Exceptional 11.7% |
| Uruguayans | 98.8 /100 | #98 | Exceptional 11.7% |
| Immigrants | Philippines | 98.6 /100 | #99 | Exceptional 11.7% |
| Immigrants | Uruguay | 98.5 /100 | #100 | Exceptional 11.7% |
Demographics Similar to Ecuadorians by Female Disability
In terms of female disability, the demographic groups most similar to Ecuadorians are Immigrants from Norway (11.9%, a difference of 0.060%), Immigrants from Hungary (11.9%, a difference of 0.090%), Ugandan (11.9%, a difference of 0.10%), Central American (11.9%, a difference of 0.12%), and Kenyan (11.9%, a difference of 0.19%).
| Demographics | Rating | Rank | Female Disability |
| Arabs | 95.1 /100 | #131 | Exceptional 11.9% |
| Immigrants | Syria | 94.6 /100 | #132 | Exceptional 11.9% |
| Kenyans | 94.5 /100 | #133 | Exceptional 11.9% |
| Immigrants | Nicaragua | 94.5 /100 | #134 | Exceptional 11.9% |
| Central Americans | 94.2 /100 | #135 | Exceptional 11.9% |
| Ugandans | 94.0 /100 | #136 | Exceptional 11.9% |
| Immigrants | Norway | 93.8 /100 | #137 | Exceptional 11.9% |
| Ecuadorians | 93.4 /100 | #138 | Exceptional 11.9% |
| Immigrants | Hungary | 92.8 /100 | #139 | Exceptional 11.9% |
| Romanians | 91.6 /100 | #140 | Exceptional 11.9% |
| Immigrants | Ecuador | 91.5 /100 | #141 | Exceptional 11.9% |
| Immigrants | Africa | 90.0 /100 | #142 | Excellent 11.9% |
| Immigrants | Sudan | 89.6 /100 | #143 | Excellent 11.9% |
| Immigrants | Austria | 87.9 /100 | #144 | Excellent 12.0% |
| Estonians | 87.8 /100 | #145 | Excellent 12.0% |