Immigrants from Sierra Leone vs Immigrants from France Female Disability
COMPARE
Immigrants from Sierra Leone
Immigrants from France
Female Disability
Female Disability Comparison
Immigrants from Sierra Leone
Immigrants from France
11.6%
FEMALE DISABILITY
99.4/ 100
METRIC RATING
93rd/ 347
METRIC RANK
11.4%
FEMALE DISABILITY
99.9/ 100
METRIC RATING
61st/ 347
METRIC RANK
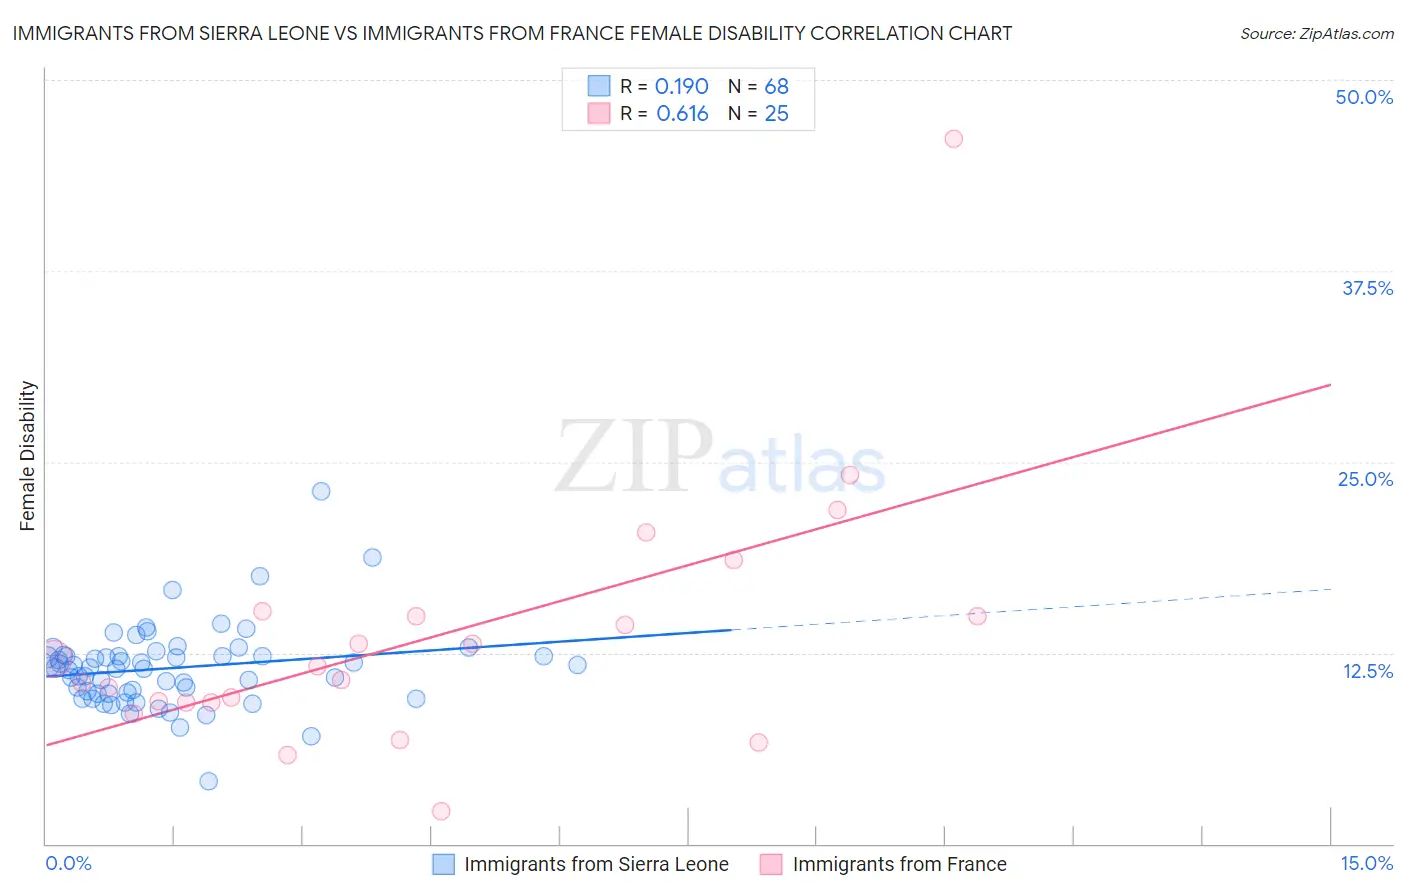
Immigrants from Sierra Leone vs Immigrants from France Female Disability Correlation Chart
The statistical analysis conducted on geographies consisting of 101,646,950 people shows a poor positive correlation between the proportion of Immigrants from Sierra Leone and percentage of females with a disability in the United States with a correlation coefficient (R) of 0.190 and weighted average of 11.6%. Similarly, the statistical analysis conducted on geographies consisting of 287,899,826 people shows a significant positive correlation between the proportion of Immigrants from France and percentage of females with a disability in the United States with a correlation coefficient (R) of 0.616 and weighted average of 11.4%, a difference of 1.7%.
Female Disability Correlation Summary
| Measurement | Immigrants from Sierra Leone | Immigrants from France |
| Minimum | 4.1% | 2.1% |
| Maximum | 23.1% | 46.2% |
| Range | 18.9% | 44.1% |
| Mean | 11.5% | 13.6% |
| Median | 11.5% | 11.7% |
| Interquartile 25% (IQ1) | 9.8% | 9.3% |
| Interquartile 75% (IQ3) | 12.3% | 15.0% |
| Interquartile Range (IQR) | 2.5% | 5.8% |
| Standard Deviation (Sample) | 2.7% | 8.5% |
| Standard Deviation (Population) | 2.7% | 8.3% |
Similar Demographics by Female Disability
Demographics Similar to Immigrants from Sierra Leone by Female Disability
In terms of female disability, the demographic groups most similar to Immigrants from Sierra Leone are Immigrants from Brazil (11.6%, a difference of 0.030%), Immigrants from Czechoslovakia (11.6%, a difference of 0.10%), Immigrants from Northern Europe (11.6%, a difference of 0.10%), Immigrants from Zimbabwe (11.6%, a difference of 0.11%), and Vietnamese (11.6%, a difference of 0.12%).
| Demographics | Rating | Rank | Female Disability |
| Immigrants | Cameroon | 99.6 /100 | #86 | Exceptional 11.6% |
| Immigrants | Denmark | 99.5 /100 | #87 | Exceptional 11.6% |
| Yup'ik | 99.5 /100 | #88 | Exceptional 11.6% |
| Vietnamese | 99.5 /100 | #89 | Exceptional 11.6% |
| Immigrants | Romania | 99.5 /100 | #90 | Exceptional 11.6% |
| Immigrants | Zimbabwe | 99.5 /100 | #91 | Exceptional 11.6% |
| Immigrants | Czechoslovakia | 99.5 /100 | #92 | Exceptional 11.6% |
| Immigrants | Sierra Leone | 99.4 /100 | #93 | Exceptional 11.6% |
| Immigrants | Brazil | 99.4 /100 | #94 | Exceptional 11.6% |
| Immigrants | Northern Europe | 99.4 /100 | #95 | Exceptional 11.6% |
| Immigrants | Russia | 99.0 /100 | #96 | Exceptional 11.7% |
| Koreans | 99.0 /100 | #97 | Exceptional 11.7% |
| Uruguayans | 98.8 /100 | #98 | Exceptional 11.7% |
| Immigrants | Philippines | 98.6 /100 | #99 | Exceptional 11.7% |
| Immigrants | Uruguay | 98.5 /100 | #100 | Exceptional 11.7% |
Demographics Similar to Immigrants from France by Female Disability
In terms of female disability, the demographic groups most similar to Immigrants from France are Immigrants from Bulgaria (11.4%, a difference of 0.060%), Sri Lankan (11.4%, a difference of 0.10%), Immigrants from Spain (11.4%, a difference of 0.17%), Immigrants from Colombia (11.4%, a difference of 0.20%), and Immigrants from El Salvador (11.4%, a difference of 0.27%).
| Demographics | Rating | Rank | Female Disability |
| Peruvians | 99.9 /100 | #54 | Exceptional 11.3% |
| Bulgarians | 99.9 /100 | #55 | Exceptional 11.3% |
| Taiwanese | 99.9 /100 | #56 | Exceptional 11.4% |
| South Americans | 99.9 /100 | #57 | Exceptional 11.4% |
| Laotians | 99.9 /100 | #58 | Exceptional 11.4% |
| Immigrants | Spain | 99.9 /100 | #59 | Exceptional 11.4% |
| Immigrants | Bulgaria | 99.9 /100 | #60 | Exceptional 11.4% |
| Immigrants | France | 99.9 /100 | #61 | Exceptional 11.4% |
| Sri Lankans | 99.9 /100 | #62 | Exceptional 11.4% |
| Immigrants | Colombia | 99.9 /100 | #63 | Exceptional 11.4% |
| Immigrants | El Salvador | 99.9 /100 | #64 | Exceptional 11.4% |
| Immigrants | South America | 99.9 /100 | #65 | Exceptional 11.4% |
| Salvadorans | 99.8 /100 | #66 | Exceptional 11.5% |
| Immigrants | Vietnam | 99.8 /100 | #67 | Exceptional 11.5% |
| Immigrants | Northern Africa | 99.8 /100 | #68 | Exceptional 11.5% |