Immigrants from Sierra Leone vs Puerto Rican Female Poverty Among 18-24 Year Olds
COMPARE
Immigrants from Sierra Leone
Puerto Rican
Female Poverty Among 18-24 Year Olds
Female Poverty Among 18-24 Year Olds Comparison
Immigrants from Sierra Leone
Puerto Ricans
19.2%
FEMALE POVERTY AMONG 18-24 YEAR OLDS
97.8/ 100
METRIC RATING
106th/ 347
METRIC RANK
29.8%
FEMALE POVERTY AMONG 18-24 YEAR OLDS
0.0/ 100
METRIC RATING
343rd/ 347
METRIC RANK
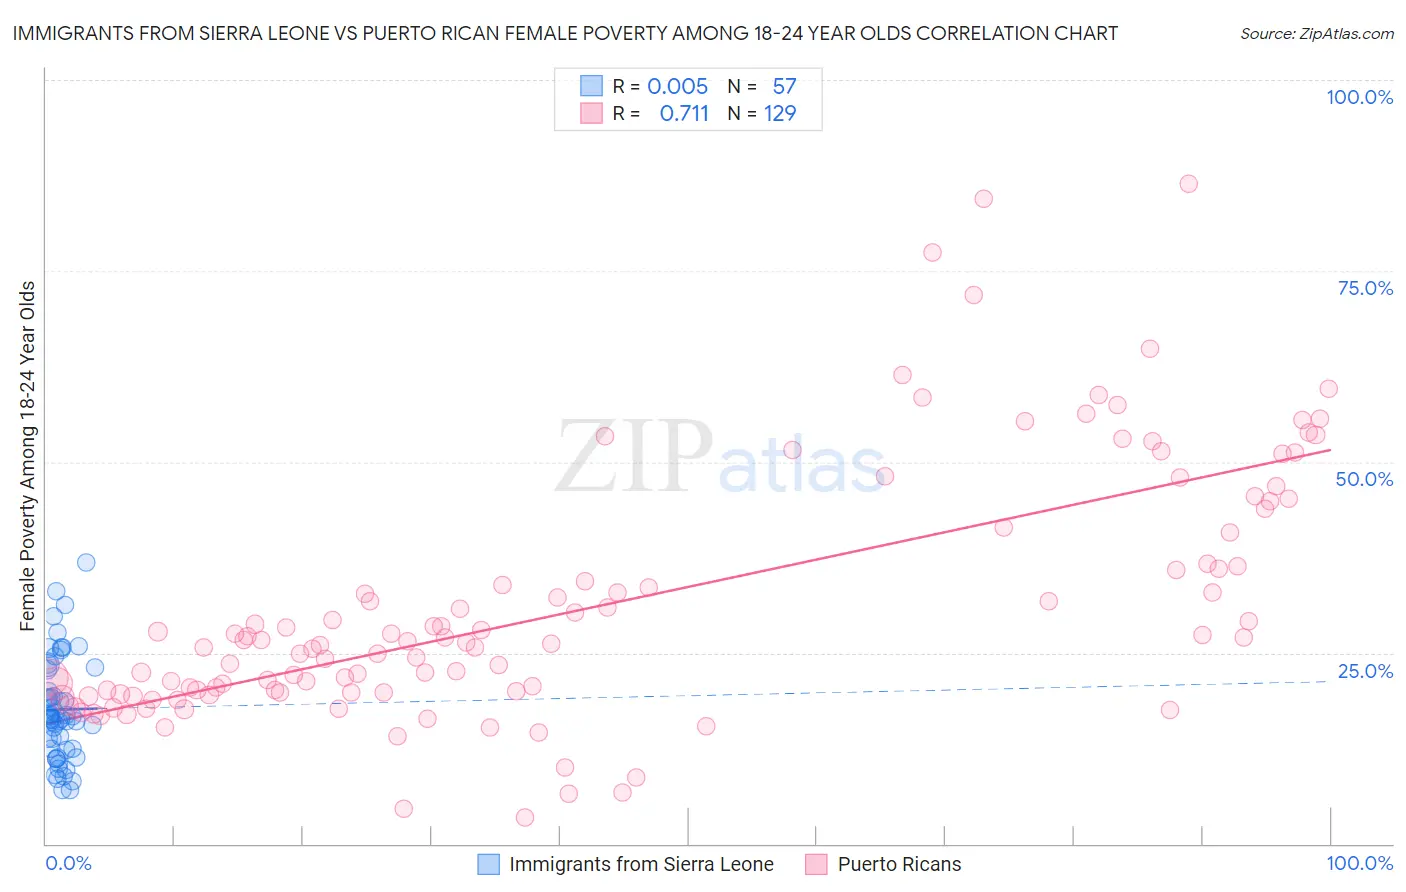
Immigrants from Sierra Leone vs Puerto Rican Female Poverty Among 18-24 Year Olds Correlation Chart
The statistical analysis conducted on geographies consisting of 100,931,142 people shows no correlation between the proportion of Immigrants from Sierra Leone and poverty level among females between the ages 18 and 24 in the United States with a correlation coefficient (R) of 0.005 and weighted average of 19.2%. Similarly, the statistical analysis conducted on geographies consisting of 506,051,184 people shows a strong positive correlation between the proportion of Puerto Ricans and poverty level among females between the ages 18 and 24 in the United States with a correlation coefficient (R) of 0.711 and weighted average of 29.8%, a difference of 55.6%.
Female Poverty Among 18-24 Year Olds Correlation Summary
| Measurement | Immigrants from Sierra Leone | Puerto Rican |
| Minimum | 7.0% | 3.5% |
| Maximum | 36.8% | 86.4% |
| Range | 29.8% | 82.9% |
| Mean | 17.6% | 31.0% |
| Median | 16.4% | 26.6% |
| Interquartile 25% (IQ1) | 12.3% | 19.8% |
| Interquartile 75% (IQ3) | 22.9% | 38.7% |
| Interquartile Range (IQR) | 10.6% | 18.9% |
| Standard Deviation (Sample) | 6.8% | 16.4% |
| Standard Deviation (Population) | 6.8% | 16.3% |
Similar Demographics by Female Poverty Among 18-24 Year Olds
Demographics Similar to Immigrants from Sierra Leone by Female Poverty Among 18-24 Year Olds
In terms of female poverty among 18-24 year olds, the demographic groups most similar to Immigrants from Sierra Leone are Immigrants from Ecuador (19.2%, a difference of 0.040%), Immigrants from Afghanistan (19.1%, a difference of 0.12%), Immigrants from Sri Lanka (19.2%, a difference of 0.15%), Serbian (19.1%, a difference of 0.16%), and Immigrants from Caribbean (19.1%, a difference of 0.20%).
| Demographics | Rating | Rank | Female Poverty Among 18-24 Year Olds |
| Immigrants | Czechoslovakia | 98.3 /100 | #99 | Exceptional 19.1% |
| Chileans | 98.3 /100 | #100 | Exceptional 19.1% |
| Ecuadorians | 98.1 /100 | #101 | Exceptional 19.1% |
| Immigrants | Caribbean | 98.1 /100 | #102 | Exceptional 19.1% |
| Serbians | 98.0 /100 | #103 | Exceptional 19.1% |
| Immigrants | Afghanistan | 98.0 /100 | #104 | Exceptional 19.1% |
| Immigrants | Ecuador | 97.8 /100 | #105 | Exceptional 19.2% |
| Immigrants | Sierra Leone | 97.8 /100 | #106 | Exceptional 19.2% |
| Immigrants | Sri Lanka | 97.5 /100 | #107 | Exceptional 19.2% |
| Immigrants | Uzbekistan | 97.3 /100 | #108 | Exceptional 19.2% |
| Immigrants | Syria | 97.2 /100 | #109 | Exceptional 19.2% |
| Laotians | 97.1 /100 | #110 | Exceptional 19.2% |
| Immigrants | Serbia | 97.1 /100 | #111 | Exceptional 19.2% |
| Immigrants | El Salvador | 96.5 /100 | #112 | Exceptional 19.3% |
| Immigrants | Cameroon | 96.3 /100 | #113 | Exceptional 19.3% |
Demographics Similar to Puerto Ricans by Female Poverty Among 18-24 Year Olds
In terms of female poverty among 18-24 year olds, the demographic groups most similar to Puerto Ricans are Navajo (30.3%, a difference of 1.6%), Kiowa (29.2%, a difference of 2.1%), Colville (29.0%, a difference of 2.8%), Tohono O'odham (31.0%, a difference of 3.9%), and Lumbee (31.1%, a difference of 4.1%).
| Demographics | Rating | Rank | Female Poverty Among 18-24 Year Olds |
| Apache | 0.0 /100 | #333 | Tragic 26.3% |
| Pueblo | 0.0 /100 | #334 | Tragic 26.9% |
| Yup'ik | 0.0 /100 | #335 | Tragic 27.0% |
| Immigrants | Yemen | 0.0 /100 | #336 | Tragic 27.5% |
| Cheyenne | 0.0 /100 | #337 | Tragic 28.1% |
| Hopi | 0.0 /100 | #338 | Tragic 28.2% |
| Pima | 0.0 /100 | #339 | Tragic 28.4% |
| Sioux | 0.0 /100 | #340 | Tragic 28.6% |
| Colville | 0.0 /100 | #341 | Tragic 29.0% |
| Kiowa | 0.0 /100 | #342 | Tragic 29.2% |
| Puerto Ricans | 0.0 /100 | #343 | Tragic 29.8% |
| Navajo | 0.0 /100 | #344 | Tragic 30.3% |
| Tohono O'odham | 0.0 /100 | #345 | Tragic 31.0% |
| Lumbee | 0.0 /100 | #346 | Tragic 31.1% |
| Crow | 0.0 /100 | #347 | Tragic 33.2% |