Immigrants from Sierra Leone vs Iraqi Disability
COMPARE
Immigrants from Sierra Leone
Iraqi
Disability
Disability Comparison
Immigrants from Sierra Leone
Iraqis
11.1%
DISABILITY
99.0/ 100
METRIC RATING
84th/ 347
METRIC RANK
11.8%
DISABILITY
30.0/ 100
METRIC RATING
184th/ 347
METRIC RANK
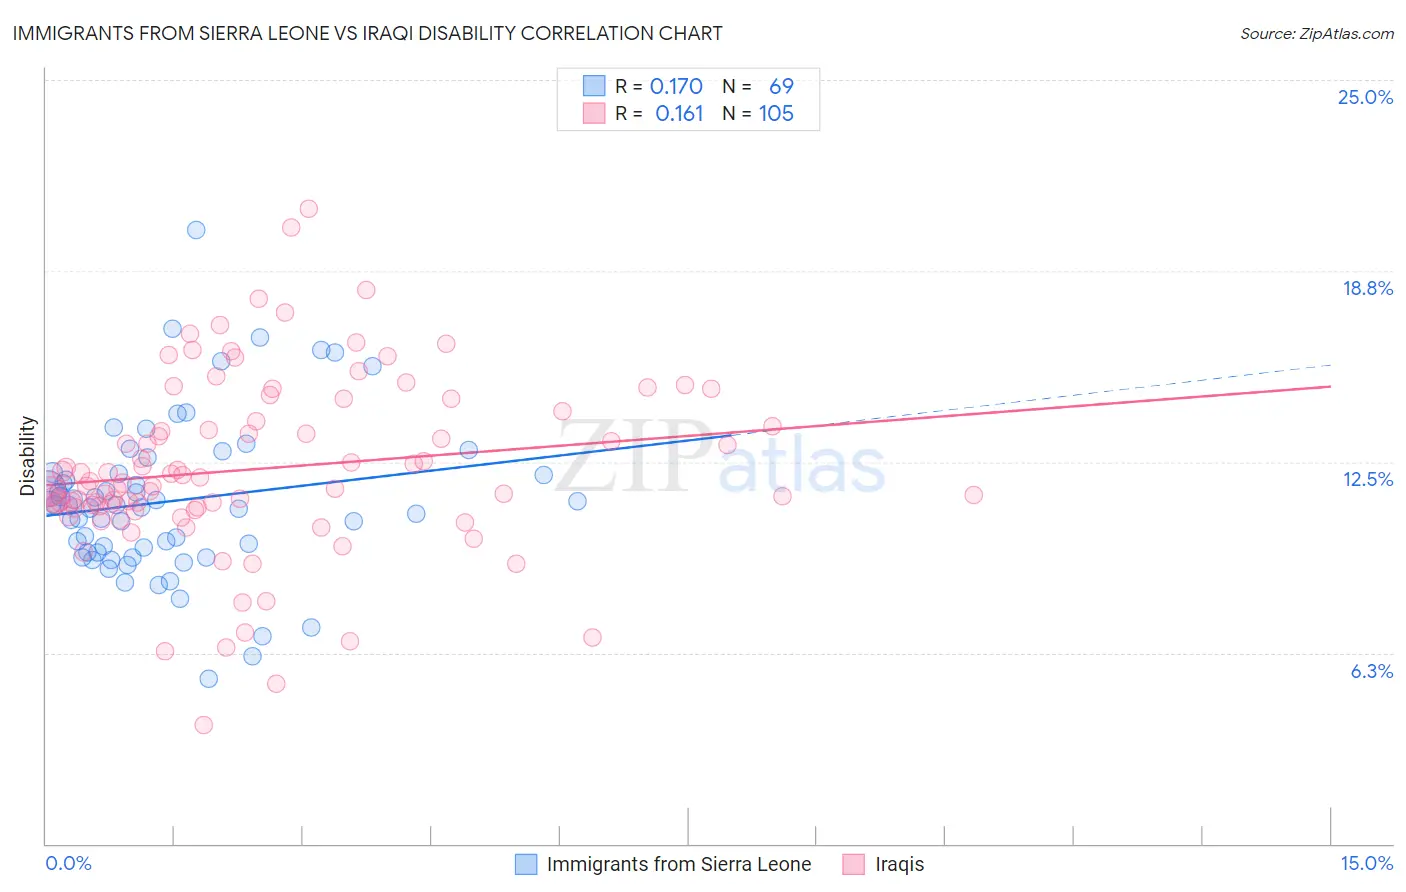
Immigrants from Sierra Leone vs Iraqi Disability Correlation Chart
The statistical analysis conducted on geographies consisting of 101,651,633 people shows a poor positive correlation between the proportion of Immigrants from Sierra Leone and percentage of population with a disability in the United States with a correlation coefficient (R) of 0.170 and weighted average of 11.1%. Similarly, the statistical analysis conducted on geographies consisting of 170,650,959 people shows a poor positive correlation between the proportion of Iraqis and percentage of population with a disability in the United States with a correlation coefficient (R) of 0.161 and weighted average of 11.8%, a difference of 6.4%.
Disability Correlation Summary
| Measurement | Immigrants from Sierra Leone | Iraqi |
| Minimum | 5.4% | 3.9% |
| Maximum | 20.1% | 20.8% |
| Range | 14.7% | 16.9% |
| Mean | 11.2% | 12.3% |
| Median | 11.1% | 11.8% |
| Interquartile 25% (IQ1) | 9.6% | 11.0% |
| Interquartile 75% (IQ3) | 12.1% | 14.0% |
| Interquartile Range (IQR) | 2.6% | 3.0% |
| Standard Deviation (Sample) | 2.6% | 2.9% |
| Standard Deviation (Population) | 2.6% | 2.9% |
Similar Demographics by Disability
Demographics Similar to Immigrants from Sierra Leone by Disability
In terms of disability, the demographic groups most similar to Immigrants from Sierra Leone are Immigrants from Switzerland (11.1%, a difference of 0.010%), Chilean (11.1%, a difference of 0.050%), Immigrants from Poland (11.1%, a difference of 0.090%), Immigrants from Belarus (11.1%, a difference of 0.15%), and Immigrants from Russia (11.1%, a difference of 0.15%).
| Demographics | Rating | Rank | Disability |
| Immigrants | Belgium | 99.3 /100 | #77 | Exceptional 11.0% |
| Immigrants | Cameroon | 99.3 /100 | #78 | Exceptional 11.1% |
| Immigrants | Jordan | 99.3 /100 | #79 | Exceptional 11.1% |
| Immigrants | Ireland | 99.3 /100 | #80 | Exceptional 11.1% |
| Immigrants | Poland | 99.1 /100 | #81 | Exceptional 11.1% |
| Chileans | 99.1 /100 | #82 | Exceptional 11.1% |
| Immigrants | Switzerland | 99.0 /100 | #83 | Exceptional 11.1% |
| Immigrants | Sierra Leone | 99.0 /100 | #84 | Exceptional 11.1% |
| Immigrants | Belarus | 98.9 /100 | #85 | Exceptional 11.1% |
| Immigrants | Russia | 98.9 /100 | #86 | Exceptional 11.1% |
| Palestinians | 98.9 /100 | #87 | Exceptional 11.1% |
| Immigrants | Romania | 98.5 /100 | #88 | Exceptional 11.2% |
| Immigrants | South Africa | 98.2 /100 | #89 | Exceptional 11.2% |
| Immigrants | Brazil | 98.1 /100 | #90 | Exceptional 11.2% |
| Immigrants | Western Asia | 98.1 /100 | #91 | Exceptional 11.2% |
Demographics Similar to Iraqis by Disability
In terms of disability, the demographic groups most similar to Iraqis are Honduran (11.8%, a difference of 0.060%), Immigrants from Burma/Myanmar (11.8%, a difference of 0.080%), Immigrants from Scotland (11.8%, a difference of 0.090%), Lebanese (11.8%, a difference of 0.11%), and Icelander (11.8%, a difference of 0.20%).
| Demographics | Rating | Rank | Disability |
| Immigrants | Central America | 46.6 /100 | #177 | Average 11.7% |
| Greeks | 46.2 /100 | #178 | Average 11.7% |
| Immigrants | Armenia | 41.9 /100 | #179 | Average 11.7% |
| Immigrants | Honduras | 37.8 /100 | #180 | Fair 11.8% |
| Immigrants | Oceania | 34.3 /100 | #181 | Fair 11.8% |
| Icelanders | 34.0 /100 | #182 | Fair 11.8% |
| Hondurans | 31.2 /100 | #183 | Fair 11.8% |
| Iraqis | 30.0 /100 | #184 | Fair 11.8% |
| Immigrants | Burma/Myanmar | 28.5 /100 | #185 | Fair 11.8% |
| Immigrants | Scotland | 28.2 /100 | #186 | Fair 11.8% |
| Lebanese | 27.9 /100 | #187 | Fair 11.8% |
| Immigrants | Mexico | 23.8 /100 | #188 | Fair 11.9% |
| Immigrants | Zaire | 21.8 /100 | #189 | Fair 11.9% |
| Immigrants | West Indies | 21.1 /100 | #190 | Fair 11.9% |
| Ute | 19.5 /100 | #191 | Poor 11.9% |