Immigrants from Sierra Leone vs Immigrants from Argentina Disability
COMPARE
Immigrants from Sierra Leone
Immigrants from Argentina
Disability
Disability Comparison
Immigrants from Sierra Leone
Immigrants from Argentina
11.1%
DISABILITY
99.0/ 100
METRIC RATING
84th/ 347
METRIC RANK
10.6%
DISABILITY
100.0/ 100
METRIC RATING
29th/ 347
METRIC RANK
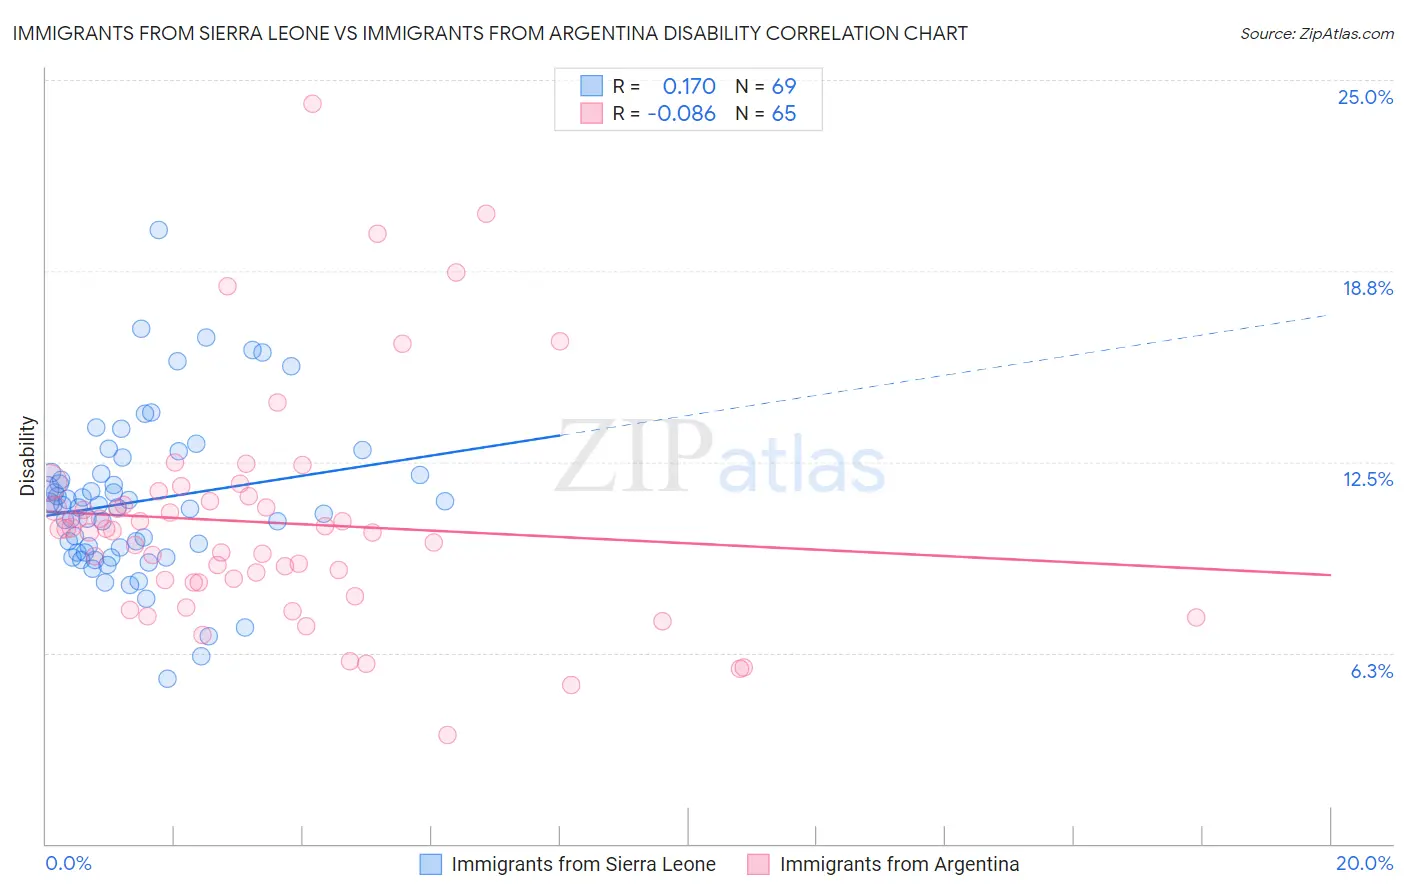
Immigrants from Sierra Leone vs Immigrants from Argentina Disability Correlation Chart
The statistical analysis conducted on geographies consisting of 101,651,633 people shows a poor positive correlation between the proportion of Immigrants from Sierra Leone and percentage of population with a disability in the United States with a correlation coefficient (R) of 0.170 and weighted average of 11.1%. Similarly, the statistical analysis conducted on geographies consisting of 264,433,054 people shows a slight negative correlation between the proportion of Immigrants from Argentina and percentage of population with a disability in the United States with a correlation coefficient (R) of -0.086 and weighted average of 10.6%, a difference of 4.6%.
Disability Correlation Summary
| Measurement | Immigrants from Sierra Leone | Immigrants from Argentina |
| Minimum | 5.4% | 3.5% |
| Maximum | 20.1% | 24.2% |
| Range | 14.7% | 20.7% |
| Mean | 11.2% | 10.5% |
| Median | 11.1% | 10.3% |
| Interquartile 25% (IQ1) | 9.6% | 8.5% |
| Interquartile 75% (IQ3) | 12.1% | 11.3% |
| Interquartile Range (IQR) | 2.6% | 2.7% |
| Standard Deviation (Sample) | 2.6% | 3.7% |
| Standard Deviation (Population) | 2.6% | 3.7% |
Similar Demographics by Disability
Demographics Similar to Immigrants from Sierra Leone by Disability
In terms of disability, the demographic groups most similar to Immigrants from Sierra Leone are Immigrants from Switzerland (11.1%, a difference of 0.010%), Chilean (11.1%, a difference of 0.050%), Immigrants from Poland (11.1%, a difference of 0.090%), Immigrants from Belarus (11.1%, a difference of 0.15%), and Immigrants from Russia (11.1%, a difference of 0.15%).
| Demographics | Rating | Rank | Disability |
| Immigrants | Belgium | 99.3 /100 | #77 | Exceptional 11.0% |
| Immigrants | Cameroon | 99.3 /100 | #78 | Exceptional 11.1% |
| Immigrants | Jordan | 99.3 /100 | #79 | Exceptional 11.1% |
| Immigrants | Ireland | 99.3 /100 | #80 | Exceptional 11.1% |
| Immigrants | Poland | 99.1 /100 | #81 | Exceptional 11.1% |
| Chileans | 99.1 /100 | #82 | Exceptional 11.1% |
| Immigrants | Switzerland | 99.0 /100 | #83 | Exceptional 11.1% |
| Immigrants | Sierra Leone | 99.0 /100 | #84 | Exceptional 11.1% |
| Immigrants | Belarus | 98.9 /100 | #85 | Exceptional 11.1% |
| Immigrants | Russia | 98.9 /100 | #86 | Exceptional 11.1% |
| Palestinians | 98.9 /100 | #87 | Exceptional 11.1% |
| Immigrants | Romania | 98.5 /100 | #88 | Exceptional 11.2% |
| Immigrants | South Africa | 98.2 /100 | #89 | Exceptional 11.2% |
| Immigrants | Brazil | 98.1 /100 | #90 | Exceptional 11.2% |
| Immigrants | Western Asia | 98.1 /100 | #91 | Exceptional 11.2% |
Demographics Similar to Immigrants from Argentina by Disability
In terms of disability, the demographic groups most similar to Immigrants from Argentina are Egyptian (10.6%, a difference of 0.13%), Immigrants from Turkey (10.6%, a difference of 0.15%), Immigrants from Egypt (10.6%, a difference of 0.23%), Cypriot (10.6%, a difference of 0.26%), and Argentinean (10.6%, a difference of 0.27%).
| Demographics | Rating | Rank | Disability |
| Immigrants | Sri Lanka | 100.0 /100 | #22 | Exceptional 10.5% |
| Immigrants | Asia | 100.0 /100 | #23 | Exceptional 10.5% |
| Venezuelans | 100.0 /100 | #24 | Exceptional 10.5% |
| Immigrants | Malaysia | 100.0 /100 | #25 | Exceptional 10.6% |
| Argentineans | 100.0 /100 | #26 | Exceptional 10.6% |
| Cypriots | 100.0 /100 | #27 | Exceptional 10.6% |
| Egyptians | 100.0 /100 | #28 | Exceptional 10.6% |
| Immigrants | Argentina | 100.0 /100 | #29 | Exceptional 10.6% |
| Immigrants | Turkey | 100.0 /100 | #30 | Exceptional 10.6% |
| Immigrants | Egypt | 100.0 /100 | #31 | Exceptional 10.6% |
| Paraguayans | 100.0 /100 | #32 | Exceptional 10.6% |
| Immigrants | Kuwait | 100.0 /100 | #33 | Exceptional 10.7% |
| Immigrants | Ethiopia | 100.0 /100 | #34 | Exceptional 10.7% |
| Immigrants | Indonesia | 100.0 /100 | #35 | Exceptional 10.7% |
| Ethiopians | 100.0 /100 | #36 | Exceptional 10.7% |