Immigrants from Sierra Leone vs Somali Disability
COMPARE
Immigrants from Sierra Leone
Somali
Disability
Disability Comparison
Immigrants from Sierra Leone
Somalis
11.1%
DISABILITY
99.0/ 100
METRIC RATING
84th/ 347
METRIC RANK
11.9%
DISABILITY
17.3/ 100
METRIC RATING
194th/ 347
METRIC RANK
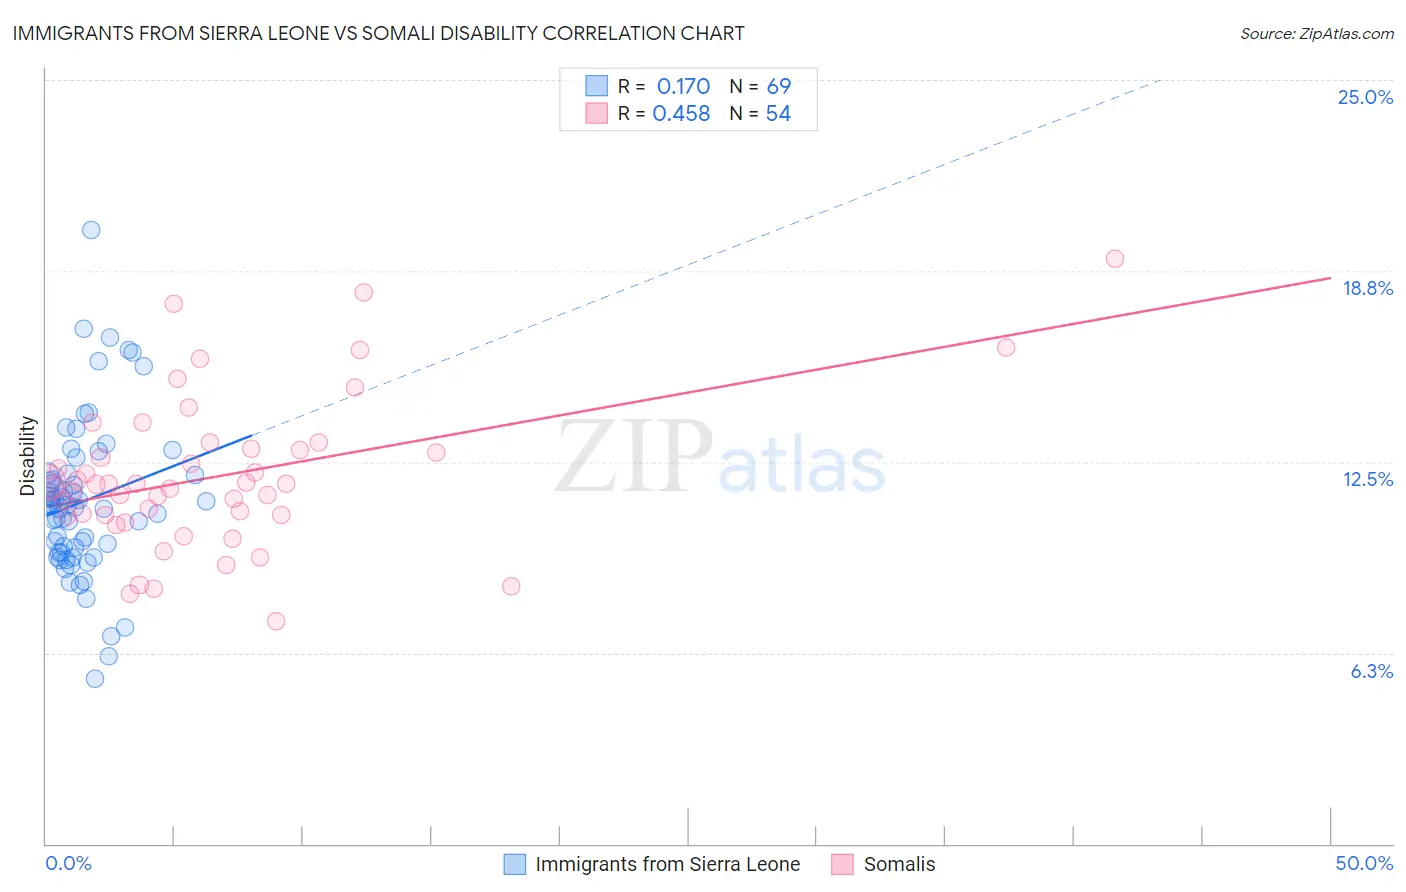
Immigrants from Sierra Leone vs Somali Disability Correlation Chart
The statistical analysis conducted on geographies consisting of 101,651,633 people shows a poor positive correlation between the proportion of Immigrants from Sierra Leone and percentage of population with a disability in the United States with a correlation coefficient (R) of 0.170 and weighted average of 11.1%. Similarly, the statistical analysis conducted on geographies consisting of 99,315,749 people shows a moderate positive correlation between the proportion of Somalis and percentage of population with a disability in the United States with a correlation coefficient (R) of 0.458 and weighted average of 11.9%, a difference of 7.2%.
Disability Correlation Summary
| Measurement | Immigrants from Sierra Leone | Somali |
| Minimum | 5.4% | 7.3% |
| Maximum | 20.1% | 19.1% |
| Range | 14.7% | 11.8% |
| Mean | 11.2% | 12.0% |
| Median | 11.1% | 11.8% |
| Interquartile 25% (IQ1) | 9.6% | 10.8% |
| Interquartile 75% (IQ3) | 12.1% | 12.9% |
| Interquartile Range (IQR) | 2.6% | 2.2% |
| Standard Deviation (Sample) | 2.6% | 2.5% |
| Standard Deviation (Population) | 2.6% | 2.5% |
Similar Demographics by Disability
Demographics Similar to Immigrants from Sierra Leone by Disability
In terms of disability, the demographic groups most similar to Immigrants from Sierra Leone are Immigrants from Switzerland (11.1%, a difference of 0.010%), Chilean (11.1%, a difference of 0.050%), Immigrants from Poland (11.1%, a difference of 0.090%), Immigrants from Belarus (11.1%, a difference of 0.15%), and Immigrants from Russia (11.1%, a difference of 0.15%).
| Demographics | Rating | Rank | Disability |
| Immigrants | Belgium | 99.3 /100 | #77 | Exceptional 11.0% |
| Immigrants | Cameroon | 99.3 /100 | #78 | Exceptional 11.1% |
| Immigrants | Jordan | 99.3 /100 | #79 | Exceptional 11.1% |
| Immigrants | Ireland | 99.3 /100 | #80 | Exceptional 11.1% |
| Immigrants | Poland | 99.1 /100 | #81 | Exceptional 11.1% |
| Chileans | 99.1 /100 | #82 | Exceptional 11.1% |
| Immigrants | Switzerland | 99.0 /100 | #83 | Exceptional 11.1% |
| Immigrants | Sierra Leone | 99.0 /100 | #84 | Exceptional 11.1% |
| Immigrants | Belarus | 98.9 /100 | #85 | Exceptional 11.1% |
| Immigrants | Russia | 98.9 /100 | #86 | Exceptional 11.1% |
| Palestinians | 98.9 /100 | #87 | Exceptional 11.1% |
| Immigrants | Romania | 98.5 /100 | #88 | Exceptional 11.2% |
| Immigrants | South Africa | 98.2 /100 | #89 | Exceptional 11.2% |
| Immigrants | Brazil | 98.1 /100 | #90 | Exceptional 11.2% |
| Immigrants | Western Asia | 98.1 /100 | #91 | Exceptional 11.2% |
Demographics Similar to Somalis by Disability
In terms of disability, the demographic groups most similar to Somalis are Immigrants from Bosnia and Herzegovina (11.9%, a difference of 0.050%), Lithuanian (11.9%, a difference of 0.11%), Barbadian (11.9%, a difference of 0.11%), Serbian (11.9%, a difference of 0.15%), and Ute (11.9%, a difference of 0.16%).
| Demographics | Rating | Rank | Disability |
| Lebanese | 27.9 /100 | #187 | Fair 11.8% |
| Immigrants | Mexico | 23.8 /100 | #188 | Fair 11.9% |
| Immigrants | Zaire | 21.8 /100 | #189 | Fair 11.9% |
| Immigrants | West Indies | 21.1 /100 | #190 | Fair 11.9% |
| Ute | 19.5 /100 | #191 | Poor 11.9% |
| Lithuanians | 18.8 /100 | #192 | Poor 11.9% |
| Immigrants | Bosnia and Herzegovina | 18.0 /100 | #193 | Poor 11.9% |
| Somalis | 17.3 /100 | #194 | Poor 11.9% |
| Barbadians | 15.8 /100 | #195 | Poor 11.9% |
| Serbians | 15.4 /100 | #196 | Poor 11.9% |
| Immigrants | Belize | 15.2 /100 | #197 | Poor 11.9% |
| Ukrainians | 14.7 /100 | #198 | Poor 11.9% |
| Immigrants | Panama | 14.6 /100 | #199 | Poor 11.9% |
| Belizeans | 12.8 /100 | #200 | Poor 11.9% |
| Assyrians/Chaldeans/Syriacs | 12.6 /100 | #201 | Poor 11.9% |