Immigrants from Senegal vs Immigrants from Cambodia Child Poverty Under the Age of 16
COMPARE
Immigrants from Senegal
Immigrants from Cambodia
Child Poverty Under the Age of 16
Child Poverty Under the Age of 16 Comparison
Immigrants from Senegal
Immigrants from Cambodia
20.6%
CHILD POVERTY UNDER THE AGE OF 16
0.0/ 100
METRIC RATING
293rd/ 347
METRIC RANK
17.8%
CHILD POVERTY UNDER THE AGE OF 16
3.3/ 100
METRIC RATING
223rd/ 347
METRIC RANK
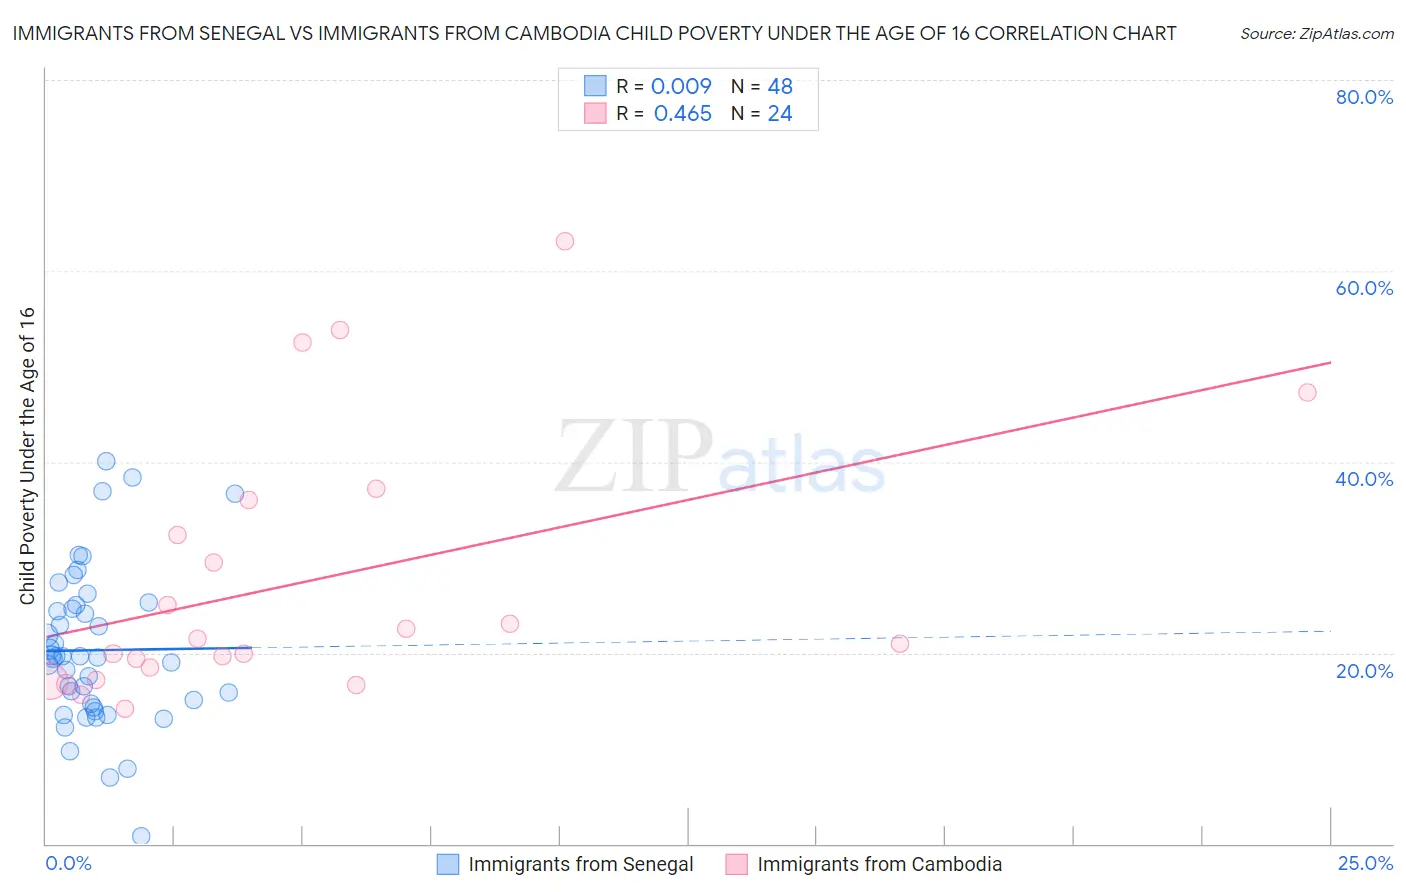
Immigrants from Senegal vs Immigrants from Cambodia Child Poverty Under the Age of 16 Correlation Chart
The statistical analysis conducted on geographies consisting of 90,000,825 people shows no correlation between the proportion of Immigrants from Senegal and poverty level among children under the age of 16 in the United States with a correlation coefficient (R) of 0.009 and weighted average of 20.6%. Similarly, the statistical analysis conducted on geographies consisting of 204,722,990 people shows a moderate positive correlation between the proportion of Immigrants from Cambodia and poverty level among children under the age of 16 in the United States with a correlation coefficient (R) of 0.465 and weighted average of 17.8%, a difference of 15.6%.
Child Poverty Under the Age of 16 Correlation Summary
| Measurement | Immigrants from Senegal | Immigrants from Cambodia |
| Minimum | 0.74% | 14.1% |
| Maximum | 40.0% | 63.1% |
| Range | 39.3% | 48.9% |
| Mean | 20.3% | 27.5% |
| Median | 19.6% | 21.2% |
| Interquartile 25% (IQ1) | 14.5% | 17.8% |
| Interquartile 75% (IQ3) | 24.8% | 34.2% |
| Interquartile Range (IQR) | 10.3% | 16.4% |
| Standard Deviation (Sample) | 8.2% | 13.8% |
| Standard Deviation (Population) | 8.1% | 13.5% |
Similar Demographics by Child Poverty Under the Age of 16
Demographics Similar to Immigrants from Senegal by Child Poverty Under the Age of 16
In terms of child poverty under the age of 16, the demographic groups most similar to Immigrants from Senegal are Haitian (20.7%, a difference of 0.21%), Mexican (20.7%, a difference of 0.34%), Immigrants from Latin America (20.5%, a difference of 0.43%), Chippewa (20.5%, a difference of 0.47%), and Immigrants from Caribbean (20.8%, a difference of 0.73%).
| Demographics | Rating | Rank | Child Poverty Under the Age of 16 |
| Immigrants | West Indies | 0.0 /100 | #286 | Tragic 20.2% |
| Blackfeet | 0.0 /100 | #287 | Tragic 20.2% |
| Immigrants | Belize | 0.0 /100 | #288 | Tragic 20.3% |
| Senegalese | 0.0 /100 | #289 | Tragic 20.4% |
| Yaqui | 0.0 /100 | #290 | Tragic 20.4% |
| Chippewa | 0.0 /100 | #291 | Tragic 20.5% |
| Immigrants | Latin America | 0.0 /100 | #292 | Tragic 20.5% |
| Immigrants | Senegal | 0.0 /100 | #293 | Tragic 20.6% |
| Haitians | 0.0 /100 | #294 | Tragic 20.7% |
| Mexicans | 0.0 /100 | #295 | Tragic 20.7% |
| Immigrants | Caribbean | 0.0 /100 | #296 | Tragic 20.8% |
| Hispanics or Latinos | 0.0 /100 | #297 | Tragic 20.8% |
| Arapaho | 0.0 /100 | #298 | Tragic 20.8% |
| Immigrants | Haiti | 0.0 /100 | #299 | Tragic 20.9% |
| Indonesians | 0.0 /100 | #300 | Tragic 21.0% |
Demographics Similar to Immigrants from Cambodia by Child Poverty Under the Age of 16
In terms of child poverty under the age of 16, the demographic groups most similar to Immigrants from Cambodia are Immigrants from Armenia (17.8%, a difference of 0.24%), Osage (17.9%, a difference of 0.24%), Cuban (17.8%, a difference of 0.30%), Immigrants from Panama (17.7%, a difference of 0.57%), and Nonimmigrants (17.9%, a difference of 0.60%).
| Demographics | Rating | Rank | Child Poverty Under the Age of 16 |
| Sierra Leoneans | 5.7 /100 | #216 | Tragic 17.6% |
| Immigrants | Eastern Africa | 5.3 /100 | #217 | Tragic 17.6% |
| Moroccans | 5.3 /100 | #218 | Tragic 17.6% |
| Japanese | 4.7 /100 | #219 | Tragic 17.7% |
| Immigrants | Panama | 4.1 /100 | #220 | Tragic 17.7% |
| Cubans | 3.7 /100 | #221 | Tragic 17.8% |
| Immigrants | Armenia | 3.6 /100 | #222 | Tragic 17.8% |
| Immigrants | Cambodia | 3.3 /100 | #223 | Tragic 17.8% |
| Osage | 3.1 /100 | #224 | Tragic 17.9% |
| Immigrants | Nonimmigrants | 2.7 /100 | #225 | Tragic 17.9% |
| Bermudans | 2.6 /100 | #226 | Tragic 18.0% |
| Immigrants | Africa | 2.5 /100 | #227 | Tragic 18.0% |
| Immigrants | Micronesia | 2.3 /100 | #228 | Tragic 18.0% |
| Marshallese | 1.8 /100 | #229 | Tragic 18.1% |
| Nepalese | 1.7 /100 | #230 | Tragic 18.2% |