Immigrants from Middle Africa vs Haitian Hearing Disability
COMPARE
Immigrants from Middle Africa
Haitian
Hearing Disability
Hearing Disability Comparison
Immigrants from Middle Africa
Haitians
2.8%
HEARING DISABILITY
96.5/ 100
METRIC RATING
91st/ 347
METRIC RANK
2.6%
HEARING DISABILITY
99.5/ 100
METRIC RATING
40th/ 347
METRIC RANK
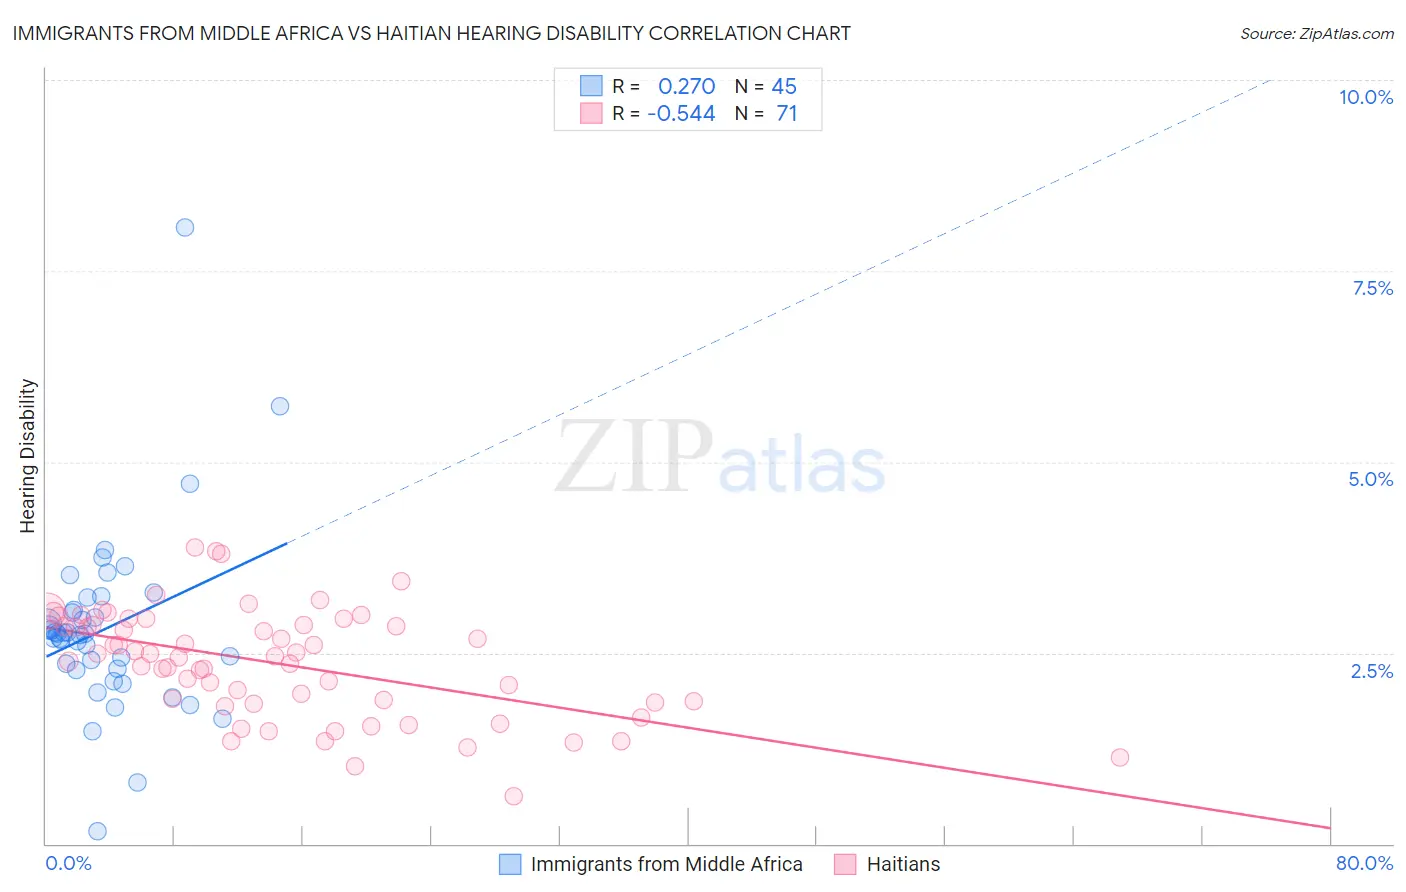
Immigrants from Middle Africa vs Haitian Hearing Disability Correlation Chart
The statistical analysis conducted on geographies consisting of 202,695,899 people shows a weak positive correlation between the proportion of Immigrants from Middle Africa and percentage of population with hearing disability in the United States with a correlation coefficient (R) of 0.270 and weighted average of 2.8%. Similarly, the statistical analysis conducted on geographies consisting of 287,794,704 people shows a substantial negative correlation between the proportion of Haitians and percentage of population with hearing disability in the United States with a correlation coefficient (R) of -0.544 and weighted average of 2.6%, a difference of 5.2%.
Hearing Disability Correlation Summary
| Measurement | Immigrants from Middle Africa | Haitian |
| Minimum | 0.16% | 0.62% |
| Maximum | 8.1% | 3.9% |
| Range | 7.9% | 3.3% |
| Mean | 2.8% | 2.4% |
| Median | 2.7% | 2.5% |
| Interquartile 25% (IQ1) | 2.3% | 1.8% |
| Interquartile 75% (IQ3) | 3.1% | 2.9% |
| Interquartile Range (IQR) | 0.87% | 1.0% |
| Standard Deviation (Sample) | 1.2% | 0.71% |
| Standard Deviation (Population) | 1.2% | 0.70% |
Similar Demographics by Hearing Disability
Demographics Similar to Immigrants from Middle Africa by Hearing Disability
In terms of hearing disability, the demographic groups most similar to Immigrants from Middle Africa are Iranian (2.8%, a difference of 0.030%), Immigrants from Morocco (2.8%, a difference of 0.080%), Belizean (2.8%, a difference of 0.11%), Immigrants from Turkey (2.8%, a difference of 0.13%), and Immigrants from Kuwait (2.8%, a difference of 0.15%).
| Demographics | Rating | Rank | Hearing Disability |
| Immigrants | Argentina | 97.0 /100 | #84 | Exceptional 2.8% |
| Immigrants | Northern Africa | 96.9 /100 | #85 | Exceptional 2.8% |
| Immigrants | Iran | 96.8 /100 | #86 | Exceptional 2.8% |
| Somalis | 96.7 /100 | #87 | Exceptional 2.8% |
| Immigrants | Turkey | 96.7 /100 | #88 | Exceptional 2.8% |
| Belizeans | 96.6 /100 | #89 | Exceptional 2.8% |
| Immigrants | Morocco | 96.6 /100 | #90 | Exceptional 2.8% |
| Immigrants | Middle Africa | 96.5 /100 | #91 | Exceptional 2.8% |
| Iranians | 96.4 /100 | #92 | Exceptional 2.8% |
| Immigrants | Kuwait | 96.3 /100 | #93 | Exceptional 2.8% |
| Uruguayans | 95.9 /100 | #94 | Exceptional 2.8% |
| Israelis | 95.9 /100 | #95 | Exceptional 2.8% |
| Immigrants | Somalia | 95.5 /100 | #96 | Exceptional 2.8% |
| Immigrants | Afghanistan | 95.3 /100 | #97 | Exceptional 2.8% |
| Immigrants | Honduras | 95.1 /100 | #98 | Exceptional 2.8% |
Demographics Similar to Haitians by Hearing Disability
In terms of hearing disability, the demographic groups most similar to Haitians are Immigrants from China (2.6%, a difference of 0.080%), Immigrants from Jamaica (2.6%, a difference of 0.32%), Immigrants from Taiwan (2.6%, a difference of 0.34%), West Indian (2.6%, a difference of 0.34%), and Senegalese (2.6%, a difference of 0.35%).
| Demographics | Rating | Rank | Hearing Disability |
| Filipinos | 99.6 /100 | #33 | Exceptional 2.6% |
| Immigrants | Pakistan | 99.6 /100 | #34 | Exceptional 2.6% |
| Salvadorans | 99.6 /100 | #35 | Exceptional 2.6% |
| Okinawans | 99.6 /100 | #36 | Exceptional 2.6% |
| Immigrants | Western Africa | 99.6 /100 | #37 | Exceptional 2.6% |
| Immigrants | Jamaica | 99.5 /100 | #38 | Exceptional 2.6% |
| Immigrants | China | 99.5 /100 | #39 | Exceptional 2.6% |
| Haitians | 99.5 /100 | #40 | Exceptional 2.6% |
| Immigrants | Taiwan | 99.4 /100 | #41 | Exceptional 2.6% |
| West Indians | 99.4 /100 | #42 | Exceptional 2.6% |
| Senegalese | 99.4 /100 | #43 | Exceptional 2.6% |
| Nigerians | 99.4 /100 | #44 | Exceptional 2.6% |
| Venezuelans | 99.4 /100 | #45 | Exceptional 2.6% |
| Immigrants | Dominica | 99.3 /100 | #46 | Exceptional 2.6% |
| Immigrants | Israel | 99.3 /100 | #47 | Exceptional 2.6% |