Immigrants from the Azores vs Haitian Hearing Disability
COMPARE
Immigrants from the Azores
Haitian
Hearing Disability
Hearing Disability Comparison
Immigrants from the Azores
Haitians
3.7%
HEARING DISABILITY
0.0/ 100
METRIC RATING
297th/ 347
METRIC RANK
2.6%
HEARING DISABILITY
99.5/ 100
METRIC RATING
40th/ 347
METRIC RANK
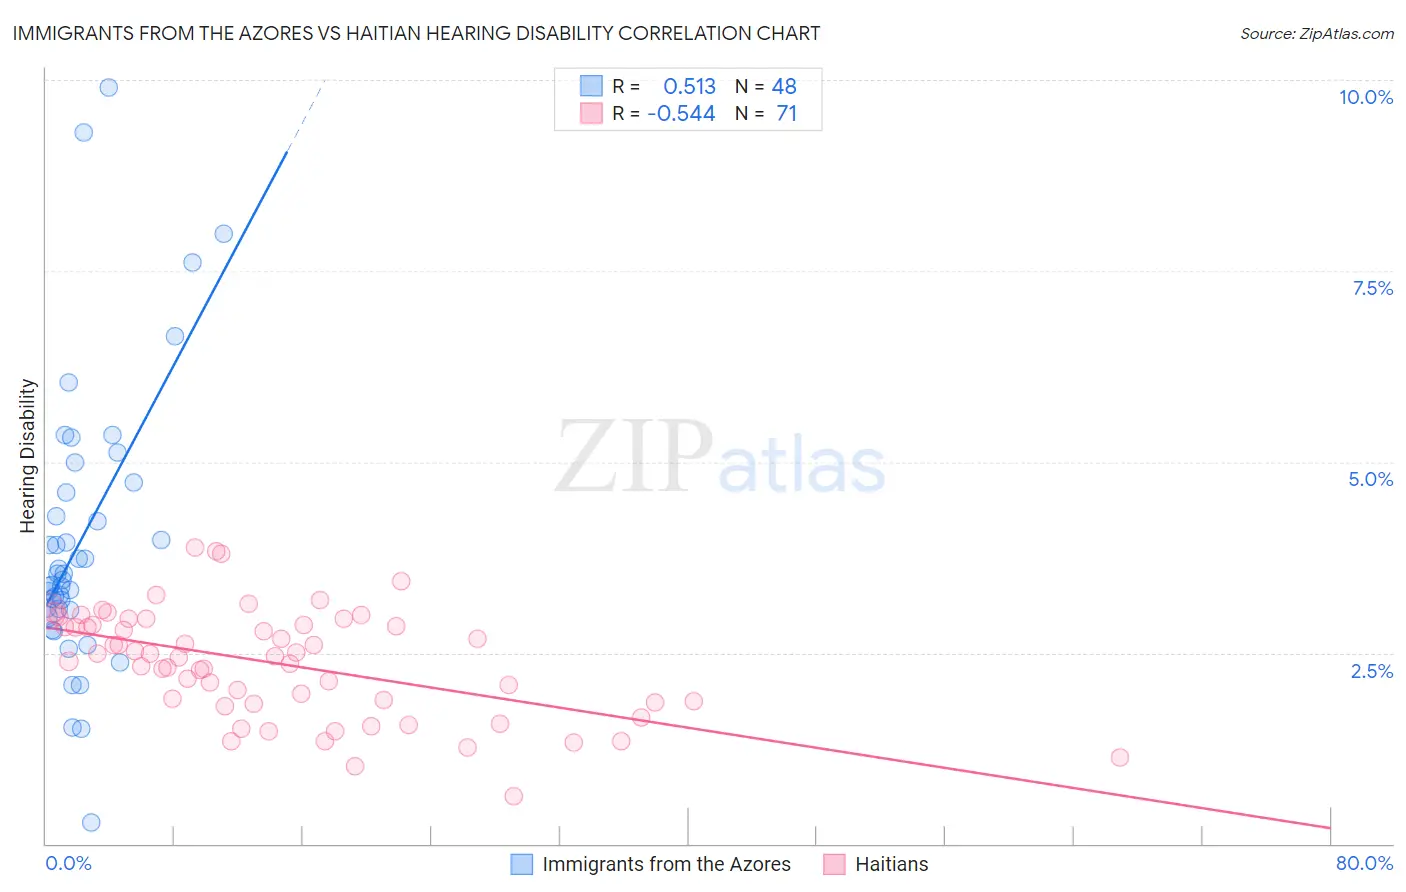
Immigrants from the Azores vs Haitian Hearing Disability Correlation Chart
The statistical analysis conducted on geographies consisting of 46,255,123 people shows a substantial positive correlation between the proportion of Immigrants from the Azores and percentage of population with hearing disability in the United States with a correlation coefficient (R) of 0.513 and weighted average of 3.7%. Similarly, the statistical analysis conducted on geographies consisting of 287,794,704 people shows a substantial negative correlation between the proportion of Haitians and percentage of population with hearing disability in the United States with a correlation coefficient (R) of -0.544 and weighted average of 2.6%, a difference of 41.5%.
Hearing Disability Correlation Summary
| Measurement | Immigrants from the Azores | Haitian |
| Minimum | 0.28% | 0.62% |
| Maximum | 9.9% | 3.9% |
| Range | 9.6% | 3.3% |
| Mean | 4.0% | 2.4% |
| Median | 3.5% | 2.5% |
| Interquartile 25% (IQ1) | 3.1% | 1.8% |
| Interquartile 75% (IQ3) | 4.7% | 2.9% |
| Interquartile Range (IQR) | 1.6% | 1.0% |
| Standard Deviation (Sample) | 1.9% | 0.71% |
| Standard Deviation (Population) | 1.9% | 0.70% |
Similar Demographics by Hearing Disability
Demographics Similar to Immigrants from the Azores by Hearing Disability
In terms of hearing disability, the demographic groups most similar to Immigrants from the Azores are Pima (3.7%, a difference of 0.070%), Celtic (3.7%, a difference of 0.19%), Welsh (3.7%, a difference of 0.20%), Iroquois (3.7%, a difference of 0.46%), and German (3.7%, a difference of 0.47%).
| Demographics | Rating | Rank | Hearing Disability |
| Whites/Caucasians | 0.0 /100 | #290 | Tragic 3.7% |
| Finns | 0.0 /100 | #291 | Tragic 3.7% |
| Native Hawaiians | 0.0 /100 | #292 | Tragic 3.7% |
| Norwegians | 0.0 /100 | #293 | Tragic 3.7% |
| Iroquois | 0.0 /100 | #294 | Tragic 3.7% |
| Welsh | 0.0 /100 | #295 | Tragic 3.7% |
| Pima | 0.0 /100 | #296 | Tragic 3.7% |
| Immigrants | Azores | 0.0 /100 | #297 | Tragic 3.7% |
| Celtics | 0.0 /100 | #298 | Tragic 3.7% |
| Germans | 0.0 /100 | #299 | Tragic 3.7% |
| Scottish | 0.0 /100 | #300 | Tragic 3.7% |
| Pennsylvania Germans | 0.0 /100 | #301 | Tragic 3.7% |
| Dutch | 0.0 /100 | #302 | Tragic 3.7% |
| Menominee | 0.0 /100 | #303 | Tragic 3.7% |
| French | 0.0 /100 | #304 | Tragic 3.8% |
Demographics Similar to Haitians by Hearing Disability
In terms of hearing disability, the demographic groups most similar to Haitians are Immigrants from China (2.6%, a difference of 0.080%), Immigrants from Jamaica (2.6%, a difference of 0.32%), Immigrants from Taiwan (2.6%, a difference of 0.34%), West Indian (2.6%, a difference of 0.34%), and Senegalese (2.6%, a difference of 0.35%).
| Demographics | Rating | Rank | Hearing Disability |
| Filipinos | 99.6 /100 | #33 | Exceptional 2.6% |
| Immigrants | Pakistan | 99.6 /100 | #34 | Exceptional 2.6% |
| Salvadorans | 99.6 /100 | #35 | Exceptional 2.6% |
| Okinawans | 99.6 /100 | #36 | Exceptional 2.6% |
| Immigrants | Western Africa | 99.6 /100 | #37 | Exceptional 2.6% |
| Immigrants | Jamaica | 99.5 /100 | #38 | Exceptional 2.6% |
| Immigrants | China | 99.5 /100 | #39 | Exceptional 2.6% |
| Haitians | 99.5 /100 | #40 | Exceptional 2.6% |
| Immigrants | Taiwan | 99.4 /100 | #41 | Exceptional 2.6% |
| West Indians | 99.4 /100 | #42 | Exceptional 2.6% |
| Senegalese | 99.4 /100 | #43 | Exceptional 2.6% |
| Nigerians | 99.4 /100 | #44 | Exceptional 2.6% |
| Venezuelans | 99.4 /100 | #45 | Exceptional 2.6% |
| Immigrants | Dominica | 99.3 /100 | #46 | Exceptional 2.6% |
| Immigrants | Israel | 99.3 /100 | #47 | Exceptional 2.6% |