Scandinavian vs Haitian Hearing Disability
COMPARE
Scandinavian
Haitian
Hearing Disability
Hearing Disability Comparison
Scandinavians
Haitians
3.6%
HEARING DISABILITY
0.0/ 100
METRIC RATING
281st/ 347
METRIC RANK
2.6%
HEARING DISABILITY
99.5/ 100
METRIC RATING
40th/ 347
METRIC RANK
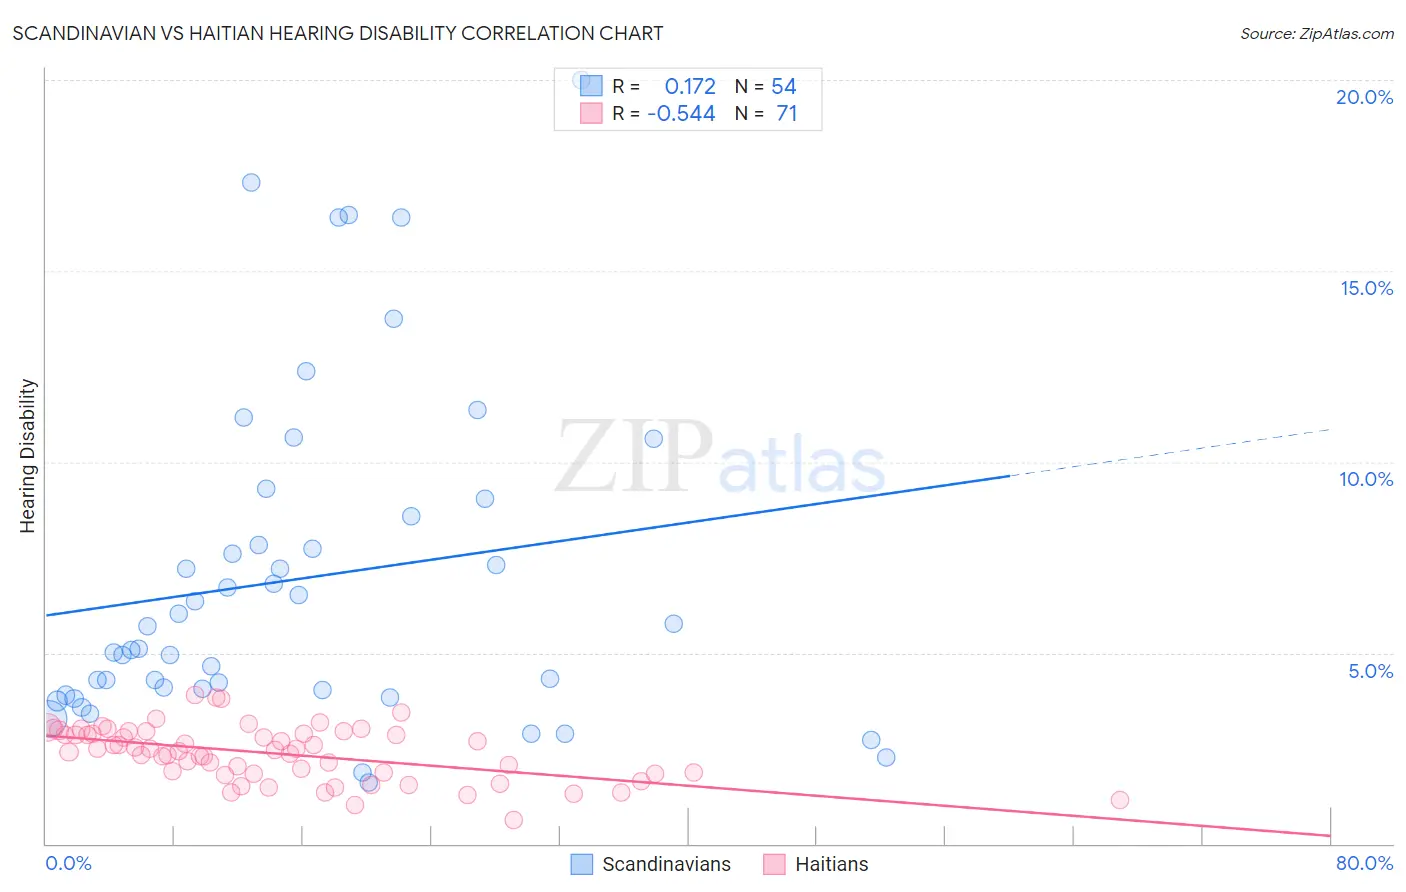
Scandinavian vs Haitian Hearing Disability Correlation Chart
The statistical analysis conducted on geographies consisting of 472,380,661 people shows a poor positive correlation between the proportion of Scandinavians and percentage of population with hearing disability in the United States with a correlation coefficient (R) of 0.172 and weighted average of 3.6%. Similarly, the statistical analysis conducted on geographies consisting of 287,794,704 people shows a substantial negative correlation between the proportion of Haitians and percentage of population with hearing disability in the United States with a correlation coefficient (R) of -0.544 and weighted average of 2.6%, a difference of 37.4%.
Hearing Disability Correlation Summary
| Measurement | Scandinavian | Haitian |
| Minimum | 1.6% | 0.62% |
| Maximum | 20.0% | 3.9% |
| Range | 18.4% | 3.3% |
| Mean | 6.9% | 2.4% |
| Median | 5.4% | 2.5% |
| Interquartile 25% (IQ1) | 4.0% | 1.8% |
| Interquartile 75% (IQ3) | 8.6% | 2.9% |
| Interquartile Range (IQR) | 4.6% | 1.0% |
| Standard Deviation (Sample) | 4.3% | 0.71% |
| Standard Deviation (Population) | 4.3% | 0.70% |
Similar Demographics by Hearing Disability
Demographics Similar to Scandinavians by Hearing Disability
In terms of hearing disability, the demographic groups most similar to Scandinavians are French American Indian (3.6%, a difference of 0.060%), Swedish (3.6%, a difference of 0.090%), Slovak (3.6%, a difference of 0.12%), Blackfeet (3.6%, a difference of 0.34%), and Basque (3.6%, a difference of 0.39%).
| Demographics | Rating | Rank | Hearing Disability |
| Swiss | 0.0 /100 | #274 | Tragic 3.5% |
| Czechoslovakians | 0.0 /100 | #275 | Tragic 3.6% |
| Danes | 0.0 /100 | #276 | Tragic 3.6% |
| Immigrants | Nonimmigrants | 0.0 /100 | #277 | Tragic 3.6% |
| Basques | 0.0 /100 | #278 | Tragic 3.6% |
| Slovaks | 0.0 /100 | #279 | Tragic 3.6% |
| French American Indians | 0.0 /100 | #280 | Tragic 3.6% |
| Scandinavians | 0.0 /100 | #281 | Tragic 3.6% |
| Swedes | 0.0 /100 | #282 | Tragic 3.6% |
| Blackfeet | 0.0 /100 | #283 | Tragic 3.6% |
| Immigrants | Micronesia | 0.0 /100 | #284 | Tragic 3.6% |
| Sioux | 0.0 /100 | #285 | Tragic 3.6% |
| Delaware | 0.0 /100 | #286 | Tragic 3.6% |
| Spanish | 0.0 /100 | #287 | Tragic 3.7% |
| Irish | 0.0 /100 | #288 | Tragic 3.7% |
Demographics Similar to Haitians by Hearing Disability
In terms of hearing disability, the demographic groups most similar to Haitians are Immigrants from China (2.6%, a difference of 0.080%), Immigrants from Jamaica (2.6%, a difference of 0.32%), Immigrants from Taiwan (2.6%, a difference of 0.34%), West Indian (2.6%, a difference of 0.34%), and Senegalese (2.6%, a difference of 0.35%).
| Demographics | Rating | Rank | Hearing Disability |
| Filipinos | 99.6 /100 | #33 | Exceptional 2.6% |
| Immigrants | Pakistan | 99.6 /100 | #34 | Exceptional 2.6% |
| Salvadorans | 99.6 /100 | #35 | Exceptional 2.6% |
| Okinawans | 99.6 /100 | #36 | Exceptional 2.6% |
| Immigrants | Western Africa | 99.6 /100 | #37 | Exceptional 2.6% |
| Immigrants | Jamaica | 99.5 /100 | #38 | Exceptional 2.6% |
| Immigrants | China | 99.5 /100 | #39 | Exceptional 2.6% |
| Haitians | 99.5 /100 | #40 | Exceptional 2.6% |
| Immigrants | Taiwan | 99.4 /100 | #41 | Exceptional 2.6% |
| West Indians | 99.4 /100 | #42 | Exceptional 2.6% |
| Senegalese | 99.4 /100 | #43 | Exceptional 2.6% |
| Nigerians | 99.4 /100 | #44 | Exceptional 2.6% |
| Venezuelans | 99.4 /100 | #45 | Exceptional 2.6% |
| Immigrants | Dominica | 99.3 /100 | #46 | Exceptional 2.6% |
| Immigrants | Israel | 99.3 /100 | #47 | Exceptional 2.6% |