Immigrants from Saudi Arabia vs Seminole Female Disability
COMPARE
Immigrants from Saudi Arabia
Seminole
Female Disability
Female Disability Comparison
Immigrants from Saudi Arabia
Seminole
11.3%
FEMALE DISABILITY
99.9/ 100
METRIC RATING
53rd/ 347
METRIC RANK
15.0%
FEMALE DISABILITY
0.0/ 100
METRIC RATING
336th/ 347
METRIC RANK
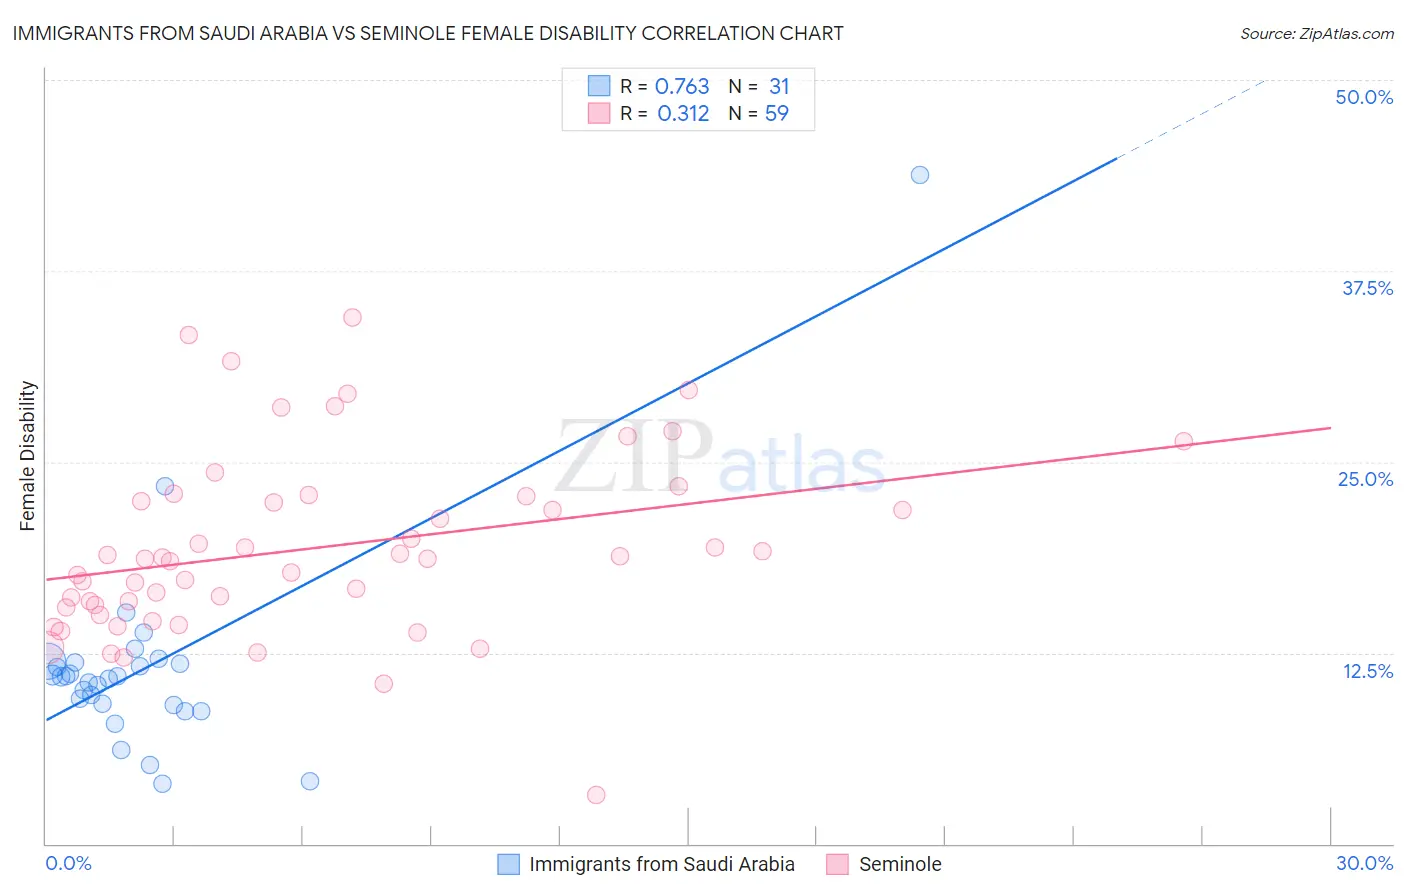
Immigrants from Saudi Arabia vs Seminole Female Disability Correlation Chart
The statistical analysis conducted on geographies consisting of 164,285,466 people shows a strong positive correlation between the proportion of Immigrants from Saudi Arabia and percentage of females with a disability in the United States with a correlation coefficient (R) of 0.763 and weighted average of 11.3%. Similarly, the statistical analysis conducted on geographies consisting of 118,309,192 people shows a mild positive correlation between the proportion of Seminole and percentage of females with a disability in the United States with a correlation coefficient (R) of 0.312 and weighted average of 15.0%, a difference of 32.1%.
Female Disability Correlation Summary
| Measurement | Immigrants from Saudi Arabia | Seminole |
| Minimum | 3.9% | 3.2% |
| Maximum | 43.8% | 34.4% |
| Range | 39.8% | 31.3% |
| Mean | 11.6% | 19.4% |
| Median | 10.9% | 18.6% |
| Interquartile 25% (IQ1) | 9.1% | 15.5% |
| Interquartile 75% (IQ3) | 11.9% | 22.7% |
| Interquartile Range (IQR) | 2.8% | 7.2% |
| Standard Deviation (Sample) | 6.9% | 6.0% |
| Standard Deviation (Population) | 6.8% | 6.0% |
Similar Demographics by Female Disability
Demographics Similar to Immigrants from Saudi Arabia by Female Disability
In terms of female disability, the demographic groups most similar to Immigrants from Saudi Arabia are Immigrants from Peru (11.3%, a difference of 0.040%), Peruvian (11.3%, a difference of 0.060%), Bulgarian (11.3%, a difference of 0.070%), Immigrants from Belgium (11.3%, a difference of 0.16%), and Inupiat (11.3%, a difference of 0.24%).
| Demographics | Rating | Rank | Female Disability |
| Immigrants | Nepal | 100.0 /100 | #46 | Exceptional 11.3% |
| Jordanians | 100.0 /100 | #47 | Exceptional 11.3% |
| Zimbabweans | 100.0 /100 | #48 | Exceptional 11.3% |
| Tongans | 100.0 /100 | #49 | Exceptional 11.3% |
| Inupiat | 100.0 /100 | #50 | Exceptional 11.3% |
| Immigrants | Belgium | 100.0 /100 | #51 | Exceptional 11.3% |
| Immigrants | Peru | 99.9 /100 | #52 | Exceptional 11.3% |
| Immigrants | Saudi Arabia | 99.9 /100 | #53 | Exceptional 11.3% |
| Peruvians | 99.9 /100 | #54 | Exceptional 11.3% |
| Bulgarians | 99.9 /100 | #55 | Exceptional 11.3% |
| Taiwanese | 99.9 /100 | #56 | Exceptional 11.4% |
| South Americans | 99.9 /100 | #57 | Exceptional 11.4% |
| Laotians | 99.9 /100 | #58 | Exceptional 11.4% |
| Immigrants | Spain | 99.9 /100 | #59 | Exceptional 11.4% |
| Immigrants | Bulgaria | 99.9 /100 | #60 | Exceptional 11.4% |
Demographics Similar to Seminole by Female Disability
In terms of female disability, the demographic groups most similar to Seminole are Tohono O'odham (15.0%, a difference of 0.12%), Dutch West Indian (15.0%, a difference of 0.26%), Cajun (14.9%, a difference of 0.67%), Colville (15.1%, a difference of 0.67%), and Cherokee (14.9%, a difference of 0.69%).
| Demographics | Rating | Rank | Female Disability |
| Osage | 0.0 /100 | #329 | Tragic 14.3% |
| Yuman | 0.0 /100 | #330 | Tragic 14.5% |
| Immigrants | Cabo Verde | 0.0 /100 | #331 | Tragic 14.6% |
| Pima | 0.0 /100 | #332 | Tragic 14.8% |
| Immigrants | Azores | 0.0 /100 | #333 | Tragic 14.9% |
| Cherokee | 0.0 /100 | #334 | Tragic 14.9% |
| Cajuns | 0.0 /100 | #335 | Tragic 14.9% |
| Seminole | 0.0 /100 | #336 | Tragic 15.0% |
| Tohono O'odham | 0.0 /100 | #337 | Tragic 15.0% |
| Dutch West Indians | 0.0 /100 | #338 | Tragic 15.0% |
| Colville | 0.0 /100 | #339 | Tragic 15.1% |
| Chickasaw | 0.0 /100 | #340 | Tragic 15.2% |
| Choctaw | 0.0 /100 | #341 | Tragic 15.4% |
| Creek | 0.0 /100 | #342 | Tragic 15.7% |
| Lumbee | 0.0 /100 | #343 | Tragic 15.8% |