Immigrants from Saudi Arabia vs Canadian Female Disability
COMPARE
Immigrants from Saudi Arabia
Canadian
Female Disability
Female Disability Comparison
Immigrants from Saudi Arabia
Canadians
11.3%
FEMALE DISABILITY
99.9/ 100
METRIC RATING
53rd/ 347
METRIC RANK
12.6%
FEMALE DISABILITY
2.6/ 100
METRIC RATING
242nd/ 347
METRIC RANK
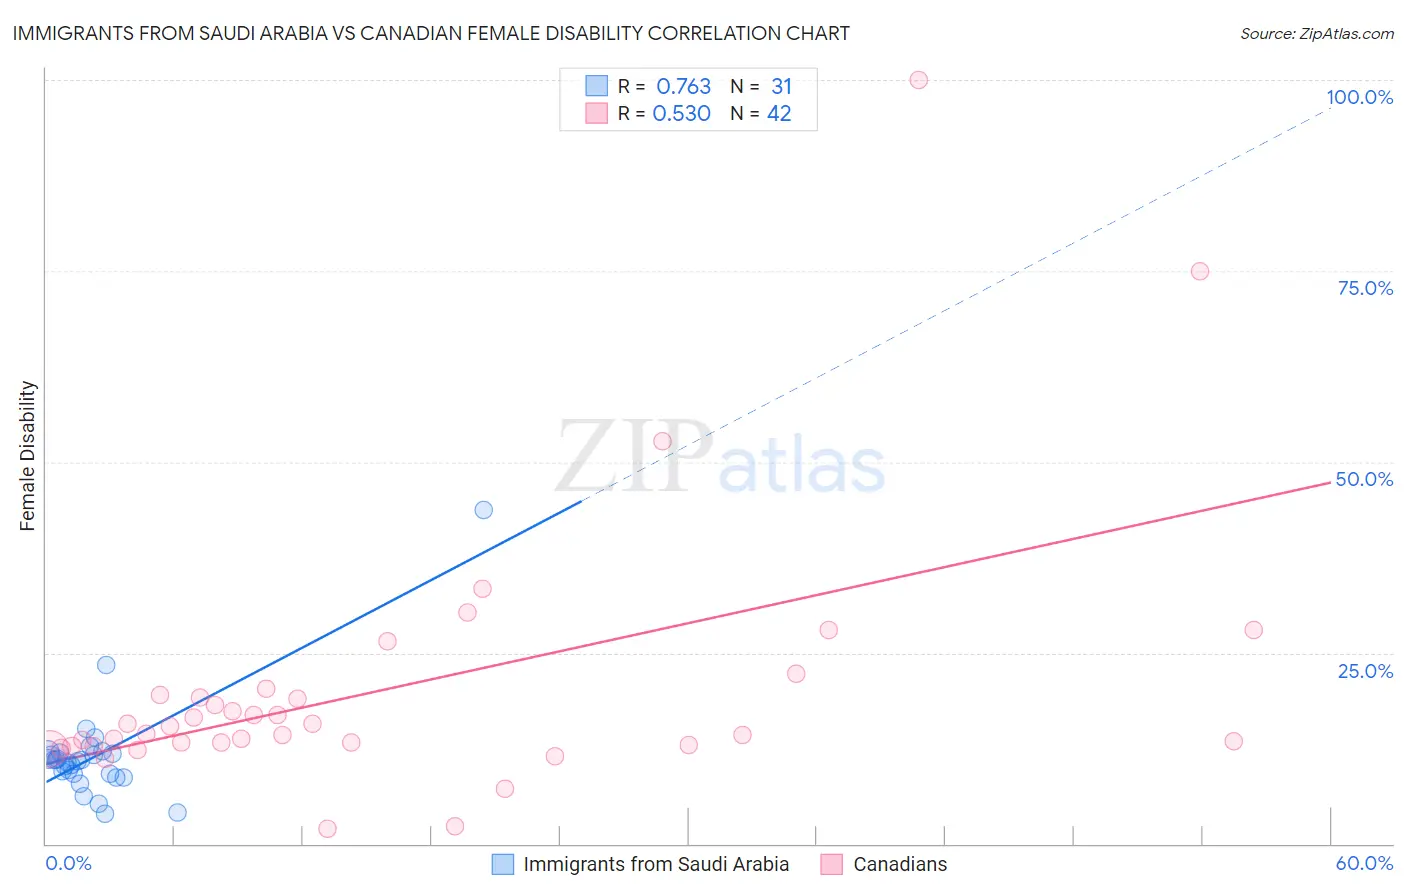
Immigrants from Saudi Arabia vs Canadian Female Disability Correlation Chart
The statistical analysis conducted on geographies consisting of 164,285,466 people shows a strong positive correlation between the proportion of Immigrants from Saudi Arabia and percentage of females with a disability in the United States with a correlation coefficient (R) of 0.763 and weighted average of 11.3%. Similarly, the statistical analysis conducted on geographies consisting of 437,475,870 people shows a substantial positive correlation between the proportion of Canadians and percentage of females with a disability in the United States with a correlation coefficient (R) of 0.530 and weighted average of 12.6%, a difference of 11.4%.
Female Disability Correlation Summary
| Measurement | Immigrants from Saudi Arabia | Canadian |
| Minimum | 3.9% | 2.0% |
| Maximum | 43.8% | 100.0% |
| Range | 39.8% | 98.0% |
| Mean | 11.6% | 20.3% |
| Median | 10.9% | 14.9% |
| Interquartile 25% (IQ1) | 9.1% | 12.9% |
| Interquartile 75% (IQ3) | 11.9% | 19.4% |
| Interquartile Range (IQR) | 2.8% | 6.5% |
| Standard Deviation (Sample) | 6.9% | 17.6% |
| Standard Deviation (Population) | 6.8% | 17.4% |
Similar Demographics by Female Disability
Demographics Similar to Immigrants from Saudi Arabia by Female Disability
In terms of female disability, the demographic groups most similar to Immigrants from Saudi Arabia are Immigrants from Peru (11.3%, a difference of 0.040%), Peruvian (11.3%, a difference of 0.060%), Bulgarian (11.3%, a difference of 0.070%), Immigrants from Belgium (11.3%, a difference of 0.16%), and Inupiat (11.3%, a difference of 0.24%).
| Demographics | Rating | Rank | Female Disability |
| Immigrants | Nepal | 100.0 /100 | #46 | Exceptional 11.3% |
| Jordanians | 100.0 /100 | #47 | Exceptional 11.3% |
| Zimbabweans | 100.0 /100 | #48 | Exceptional 11.3% |
| Tongans | 100.0 /100 | #49 | Exceptional 11.3% |
| Inupiat | 100.0 /100 | #50 | Exceptional 11.3% |
| Immigrants | Belgium | 100.0 /100 | #51 | Exceptional 11.3% |
| Immigrants | Peru | 99.9 /100 | #52 | Exceptional 11.3% |
| Immigrants | Saudi Arabia | 99.9 /100 | #53 | Exceptional 11.3% |
| Peruvians | 99.9 /100 | #54 | Exceptional 11.3% |
| Bulgarians | 99.9 /100 | #55 | Exceptional 11.3% |
| Taiwanese | 99.9 /100 | #56 | Exceptional 11.4% |
| South Americans | 99.9 /100 | #57 | Exceptional 11.4% |
| Laotians | 99.9 /100 | #58 | Exceptional 11.4% |
| Immigrants | Spain | 99.9 /100 | #59 | Exceptional 11.4% |
| Immigrants | Bulgaria | 99.9 /100 | #60 | Exceptional 11.4% |
Demographics Similar to Canadians by Female Disability
In terms of female disability, the demographic groups most similar to Canadians are Immigrants from Senegal (12.6%, a difference of 0.010%), Alsatian (12.6%, a difference of 0.020%), Japanese (12.6%, a difference of 0.050%), Immigrants from Jamaica (12.6%, a difference of 0.16%), and Spanish American Indian (12.6%, a difference of 0.18%).
| Demographics | Rating | Rank | Female Disability |
| Malaysians | 5.0 /100 | #235 | Tragic 12.5% |
| Immigrants | West Indies | 4.4 /100 | #236 | Tragic 12.6% |
| Slavs | 3.8 /100 | #237 | Tragic 12.6% |
| Yugoslavians | 3.7 /100 | #238 | Tragic 12.6% |
| Barbadians | 3.6 /100 | #239 | Tragic 12.6% |
| German Russians | 3.2 /100 | #240 | Tragic 12.6% |
| Japanese | 2.7 /100 | #241 | Tragic 12.6% |
| Canadians | 2.6 /100 | #242 | Tragic 12.6% |
| Immigrants | Senegal | 2.5 /100 | #243 | Tragic 12.6% |
| Alsatians | 2.5 /100 | #244 | Tragic 12.6% |
| Immigrants | Jamaica | 2.2 /100 | #245 | Tragic 12.6% |
| Spanish American Indians | 2.1 /100 | #246 | Tragic 12.6% |
| Menominee | 2.1 /100 | #247 | Tragic 12.6% |
| Carpatho Rusyns | 2.0 /100 | #248 | Tragic 12.6% |
| Immigrants | Congo | 1.8 /100 | #249 | Tragic 12.7% |