Immigrants from Saudi Arabia vs Seminole Family Poverty
COMPARE
Immigrants from Saudi Arabia
Seminole
Family Poverty
Family Poverty Comparison
Immigrants from Saudi Arabia
Seminole
9.1%
FAMILY POVERTY
38.6/ 100
METRIC RATING
185th/ 347
METRIC RANK
11.9%
FAMILY POVERTY
0.0/ 100
METRIC RATING
308th/ 347
METRIC RANK
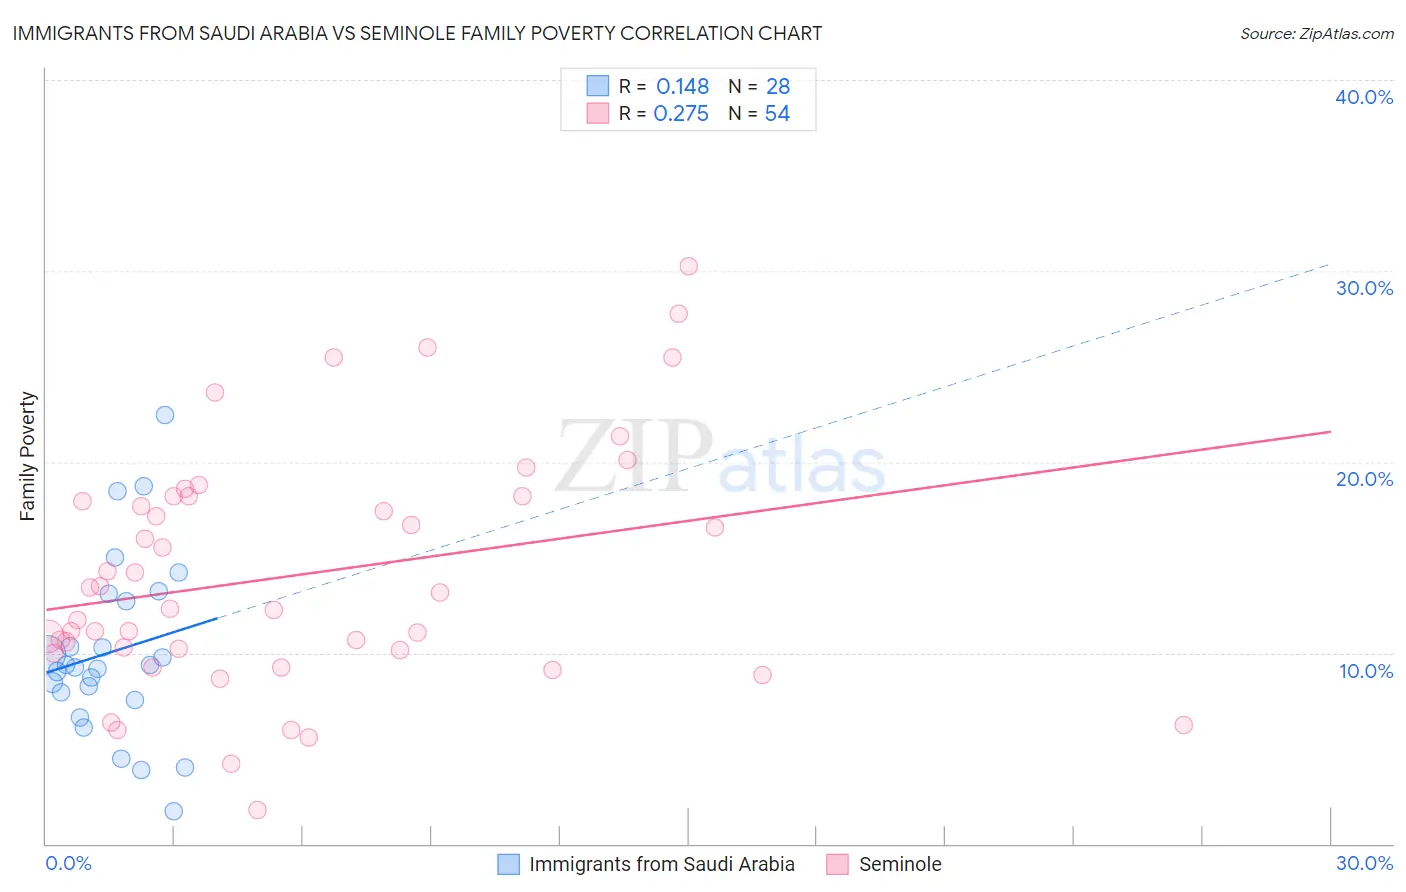
Immigrants from Saudi Arabia vs Seminole Family Poverty Correlation Chart
The statistical analysis conducted on geographies consisting of 164,117,419 people shows a poor positive correlation between the proportion of Immigrants from Saudi Arabia and poverty level among families in the United States with a correlation coefficient (R) of 0.148 and weighted average of 9.1%. Similarly, the statistical analysis conducted on geographies consisting of 118,266,338 people shows a weak positive correlation between the proportion of Seminole and poverty level among families in the United States with a correlation coefficient (R) of 0.275 and weighted average of 11.9%, a difference of 30.2%.
Family Poverty Correlation Summary
| Measurement | Immigrants from Saudi Arabia | Seminole |
| Minimum | 1.7% | 1.8% |
| Maximum | 22.5% | 30.2% |
| Range | 20.8% | 28.4% |
| Mean | 10.1% | 14.1% |
| Median | 9.3% | 12.7% |
| Interquartile 25% (IQ1) | 7.7% | 10.1% |
| Interquartile 75% (IQ3) | 12.9% | 18.2% |
| Interquartile Range (IQR) | 5.2% | 8.0% |
| Standard Deviation (Sample) | 4.7% | 6.3% |
| Standard Deviation (Population) | 4.6% | 6.2% |
Similar Demographics by Family Poverty
Demographics Similar to Immigrants from Saudi Arabia by Family Poverty
In terms of family poverty, the demographic groups most similar to Immigrants from Saudi Arabia are South American Indian (9.1%, a difference of 0.010%), Uruguayan (9.1%, a difference of 0.080%), Immigrants from Morocco (9.1%, a difference of 0.21%), Hmong (9.1%, a difference of 0.22%), and Colombian (9.2%, a difference of 0.35%).
| Demographics | Rating | Rank | Family Poverty |
| Immigrants | Cameroon | 47.1 /100 | #178 | Average 9.0% |
| Immigrants | Iraq | 44.4 /100 | #179 | Average 9.1% |
| Immigrants | Uganda | 43.4 /100 | #180 | Average 9.1% |
| Hmong | 40.2 /100 | #181 | Average 9.1% |
| Immigrants | Morocco | 40.2 /100 | #182 | Average 9.1% |
| Uruguayans | 39.2 /100 | #183 | Fair 9.1% |
| South American Indians | 38.7 /100 | #184 | Fair 9.1% |
| Immigrants | Saudi Arabia | 38.6 /100 | #185 | Fair 9.1% |
| Colombians | 36.1 /100 | #186 | Fair 9.2% |
| Delaware | 35.4 /100 | #187 | Fair 9.2% |
| Immigrants | Kenya | 34.0 /100 | #188 | Fair 9.2% |
| Immigrants | Afghanistan | 32.1 /100 | #189 | Fair 9.2% |
| Arabs | 31.5 /100 | #190 | Fair 9.2% |
| Ugandans | 28.7 /100 | #191 | Fair 9.3% |
| Spanish | 28.7 /100 | #192 | Fair 9.3% |
Demographics Similar to Seminole by Family Poverty
In terms of family poverty, the demographic groups most similar to Seminole are Immigrants from Congo (11.9%, a difference of 0.060%), Cajun (11.9%, a difference of 0.17%), Hispanic or Latino (12.0%, a difference of 0.45%), Immigrants from Guatemala (12.0%, a difference of 0.45%), and Mexican (11.8%, a difference of 0.73%).
| Demographics | Rating | Rank | Family Poverty |
| Bahamians | 0.0 /100 | #301 | Tragic 11.7% |
| Guatemalans | 0.0 /100 | #302 | Tragic 11.7% |
| Africans | 0.0 /100 | #303 | Tragic 11.8% |
| Immigrants | Latin America | 0.0 /100 | #304 | Tragic 11.8% |
| Mexicans | 0.0 /100 | #305 | Tragic 11.8% |
| Cajuns | 0.0 /100 | #306 | Tragic 11.9% |
| Immigrants | Congo | 0.0 /100 | #307 | Tragic 11.9% |
| Seminole | 0.0 /100 | #308 | Tragic 11.9% |
| Hispanics or Latinos | 0.0 /100 | #309 | Tragic 12.0% |
| Immigrants | Guatemala | 0.0 /100 | #310 | Tragic 12.0% |
| Ute | 0.0 /100 | #311 | Tragic 12.1% |
| Immigrants | Central America | 0.0 /100 | #312 | Tragic 12.1% |
| Immigrants | Caribbean | 0.0 /100 | #313 | Tragic 12.2% |
| Kiowa | 0.0 /100 | #314 | Tragic 12.2% |
| Immigrants | Mexico | 0.0 /100 | #315 | Tragic 12.3% |