Immigrants from Saudi Arabia vs Seminole Associate's Degree
COMPARE
Immigrants from Saudi Arabia
Seminole
Associate's Degree
Associate's Degree Comparison
Immigrants from Saudi Arabia
Seminole
52.6%
ASSOCIATE'S DEGREE
99.9/ 100
METRIC RATING
41st/ 347
METRIC RANK
37.7%
ASSOCIATE'S DEGREE
0.0/ 100
METRIC RATING
314th/ 347
METRIC RANK
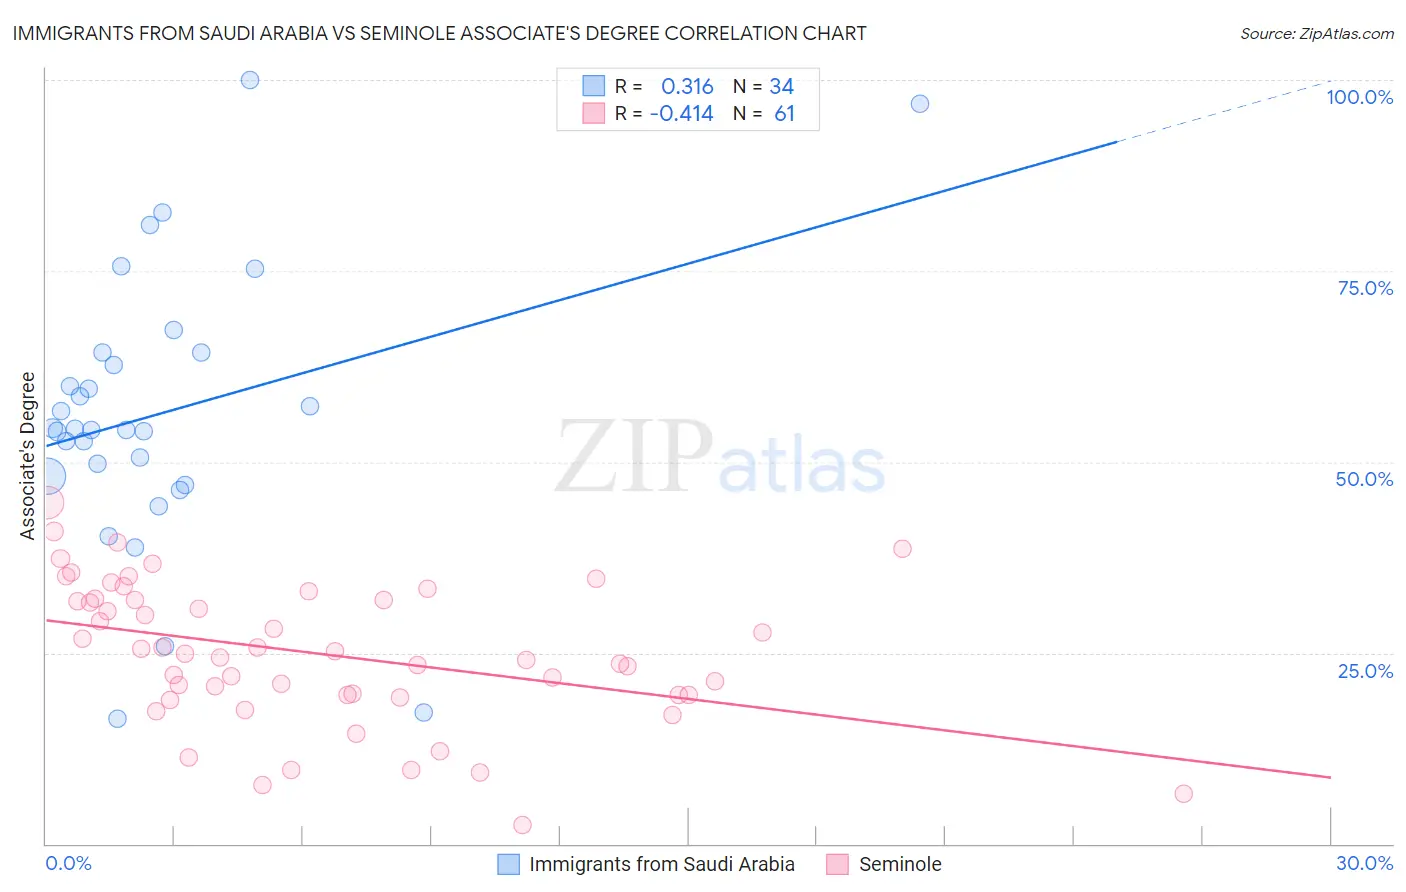
Immigrants from Saudi Arabia vs Seminole Associate's Degree Correlation Chart
The statistical analysis conducted on geographies consisting of 164,289,450 people shows a mild positive correlation between the proportion of Immigrants from Saudi Arabia and percentage of population with at least associate's degree education in the United States with a correlation coefficient (R) of 0.316 and weighted average of 52.6%. Similarly, the statistical analysis conducted on geographies consisting of 118,312,703 people shows a moderate negative correlation between the proportion of Seminole and percentage of population with at least associate's degree education in the United States with a correlation coefficient (R) of -0.414 and weighted average of 37.7%, a difference of 39.4%.
Associate's Degree Correlation Summary
| Measurement | Immigrants from Saudi Arabia | Seminole |
| Minimum | 16.3% | 2.5% |
| Maximum | 100.0% | 44.7% |
| Range | 83.7% | 42.2% |
| Mean | 56.4% | 24.9% |
| Median | 54.3% | 24.9% |
| Interquartile 25% (IQ1) | 48.1% | 19.4% |
| Interquartile 75% (IQ3) | 64.3% | 32.1% |
| Interquartile Range (IQR) | 16.2% | 12.6% |
| Standard Deviation (Sample) | 18.3% | 9.3% |
| Standard Deviation (Population) | 18.1% | 9.2% |
Similar Demographics by Associate's Degree
Demographics Similar to Immigrants from Saudi Arabia by Associate's Degree
In terms of associate's degree, the demographic groups most similar to Immigrants from Saudi Arabia are Immigrants from Malaysia (52.5%, a difference of 0.030%), Immigrants from South Africa (52.5%, a difference of 0.040%), Estonian (52.5%, a difference of 0.13%), Immigrants from Lithuania (52.4%, a difference of 0.20%), and Immigrants from Bulgaria (52.4%, a difference of 0.34%).
| Demographics | Rating | Rank | Associate's Degree |
| Bulgarians | 100.0 /100 | #34 | Exceptional 53.3% |
| Russians | 100.0 /100 | #35 | Exceptional 53.2% |
| Immigrants | Russia | 100.0 /100 | #36 | Exceptional 53.1% |
| Immigrants | Denmark | 100.0 /100 | #37 | Exceptional 53.1% |
| Mongolians | 100.0 /100 | #38 | Exceptional 53.0% |
| Immigrants | Belarus | 99.9 /100 | #39 | Exceptional 52.8% |
| Immigrants | Latvia | 99.9 /100 | #40 | Exceptional 52.8% |
| Immigrants | Saudi Arabia | 99.9 /100 | #41 | Exceptional 52.6% |
| Immigrants | Malaysia | 99.9 /100 | #42 | Exceptional 52.5% |
| Immigrants | South Africa | 99.9 /100 | #43 | Exceptional 52.5% |
| Estonians | 99.9 /100 | #44 | Exceptional 52.5% |
| Immigrants | Lithuania | 99.9 /100 | #45 | Exceptional 52.4% |
| Immigrants | Bulgaria | 99.9 /100 | #46 | Exceptional 52.4% |
| Immigrants | Kuwait | 99.9 /100 | #47 | Exceptional 52.4% |
| Immigrants | Norway | 99.9 /100 | #48 | Exceptional 52.2% |
Demographics Similar to Seminole by Associate's Degree
In terms of associate's degree, the demographic groups most similar to Seminole are Hispanic or Latino (37.7%, a difference of 0.050%), Choctaw (37.8%, a difference of 0.20%), Creek (37.6%, a difference of 0.39%), Crow (37.6%, a difference of 0.40%), and Yaqui (37.6%, a difference of 0.41%).
| Demographics | Rating | Rank | Associate's Degree |
| Immigrants | El Salvador | 0.0 /100 | #307 | Tragic 38.4% |
| Mexican American Indians | 0.0 /100 | #308 | Tragic 38.2% |
| Immigrants | Guatemala | 0.0 /100 | #309 | Tragic 38.1% |
| Immigrants | Dominican Republic | 0.0 /100 | #310 | Tragic 37.9% |
| Immigrants | Latin America | 0.0 /100 | #311 | Tragic 37.9% |
| Choctaw | 0.0 /100 | #312 | Tragic 37.8% |
| Hispanics or Latinos | 0.0 /100 | #313 | Tragic 37.7% |
| Seminole | 0.0 /100 | #314 | Tragic 37.7% |
| Creek | 0.0 /100 | #315 | Tragic 37.6% |
| Crow | 0.0 /100 | #316 | Tragic 37.6% |
| Yaqui | 0.0 /100 | #317 | Tragic 37.6% |
| Alaska Natives | 0.0 /100 | #318 | Tragic 37.5% |
| Fijians | 0.0 /100 | #319 | Tragic 37.4% |
| Cajuns | 0.0 /100 | #320 | Tragic 37.4% |
| Immigrants | Yemen | 0.0 /100 | #321 | Tragic 37.3% |