Immigrants from Fiji vs Seminole Female Disability
COMPARE
Immigrants from Fiji
Seminole
Female Disability
Female Disability Comparison
Immigrants from Fiji
Seminole
12.3%
FEMALE DISABILITY
38.2/ 100
METRIC RATING
179th/ 347
METRIC RANK
15.0%
FEMALE DISABILITY
0.0/ 100
METRIC RATING
336th/ 347
METRIC RANK
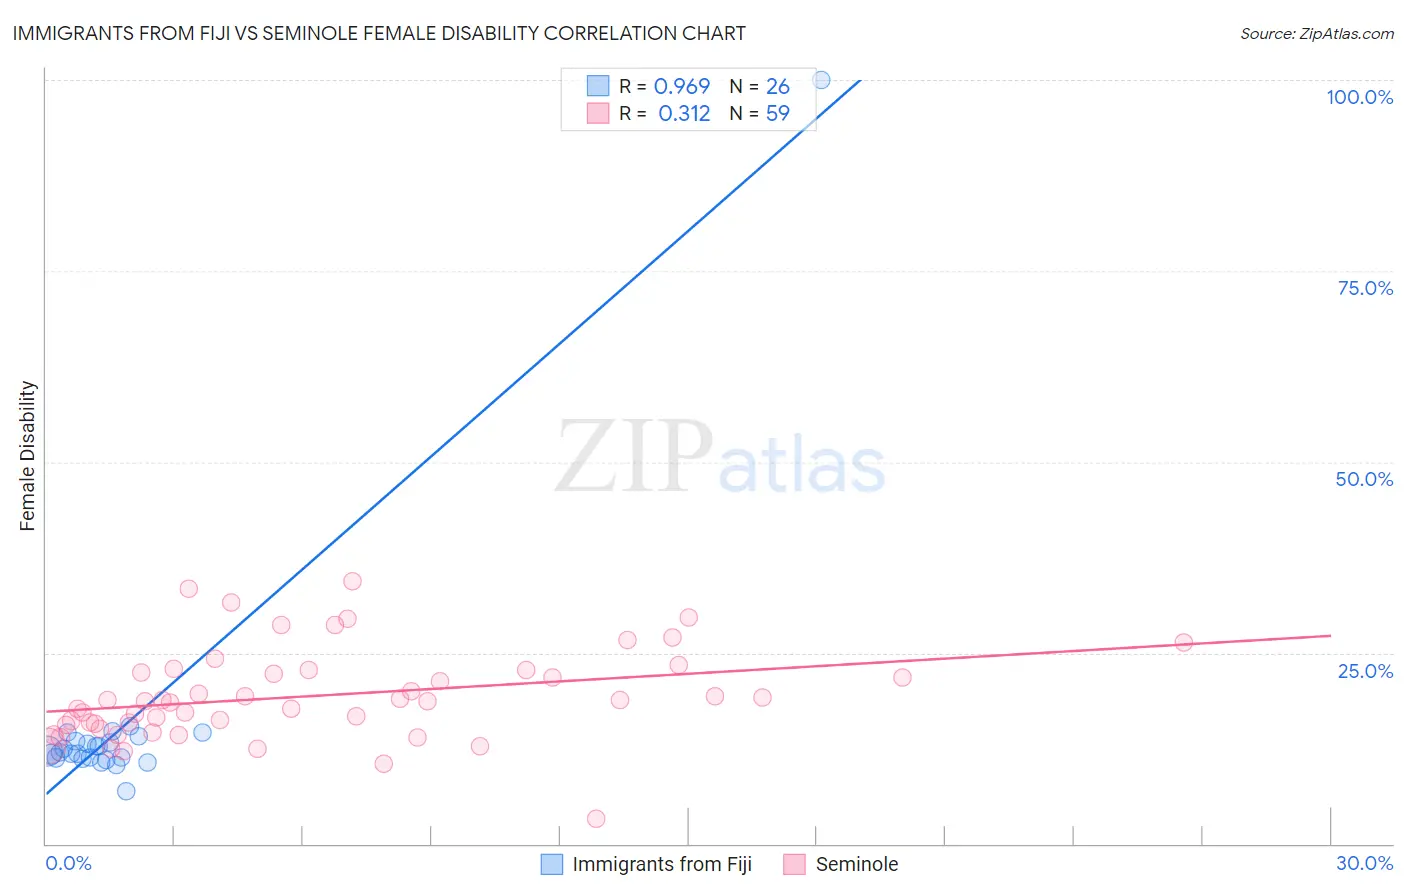
Immigrants from Fiji vs Seminole Female Disability Correlation Chart
The statistical analysis conducted on geographies consisting of 93,754,243 people shows a perfect positive correlation between the proportion of Immigrants from Fiji and percentage of females with a disability in the United States with a correlation coefficient (R) of 0.969 and weighted average of 12.3%. Similarly, the statistical analysis conducted on geographies consisting of 118,309,192 people shows a mild positive correlation between the proportion of Seminole and percentage of females with a disability in the United States with a correlation coefficient (R) of 0.312 and weighted average of 15.0%, a difference of 22.2%.
Female Disability Correlation Summary
| Measurement | Immigrants from Fiji | Seminole |
| Minimum | 6.9% | 3.2% |
| Maximum | 100.0% | 34.4% |
| Range | 93.1% | 31.3% |
| Mean | 15.6% | 19.4% |
| Median | 12.0% | 18.6% |
| Interquartile 25% (IQ1) | 11.2% | 15.5% |
| Interquartile 75% (IQ3) | 13.4% | 22.7% |
| Interquartile Range (IQR) | 2.2% | 7.2% |
| Standard Deviation (Sample) | 17.3% | 6.0% |
| Standard Deviation (Population) | 17.0% | 6.0% |
Similar Demographics by Female Disability
Demographics Similar to Immigrants from Fiji by Female Disability
In terms of female disability, the demographic groups most similar to Immigrants from Fiji are Albanian (12.3%, a difference of 0.010%), Immigrants from Canada (12.3%, a difference of 0.040%), Norwegian (12.3%, a difference of 0.050%), Cuban (12.3%, a difference of 0.070%), and Iraqi (12.3%, a difference of 0.090%).
| Demographics | Rating | Rank | Female Disability |
| Haitians | 51.9 /100 | #172 | Average 12.2% |
| Immigrants | Mexico | 50.8 /100 | #173 | Average 12.2% |
| Immigrants | England | 50.0 /100 | #174 | Average 12.2% |
| Immigrants | St. Vincent and the Grenadines | 49.7 /100 | #175 | Average 12.2% |
| Immigrants | Guyana | 43.1 /100 | #176 | Average 12.2% |
| Immigrants | Ghana | 42.5 /100 | #177 | Average 12.2% |
| Immigrants | Western Europe | 40.9 /100 | #178 | Average 12.2% |
| Immigrants | Fiji | 38.2 /100 | #179 | Fair 12.3% |
| Albanians | 37.9 /100 | #180 | Fair 12.3% |
| Immigrants | Canada | 37.2 /100 | #181 | Fair 12.3% |
| Norwegians | 36.9 /100 | #182 | Fair 12.3% |
| Cubans | 36.5 /100 | #183 | Fair 12.3% |
| Iraqis | 36.0 /100 | #184 | Fair 12.3% |
| Immigrants | Uzbekistan | 33.9 /100 | #185 | Fair 12.3% |
| Austrians | 33.3 /100 | #186 | Fair 12.3% |
Demographics Similar to Seminole by Female Disability
In terms of female disability, the demographic groups most similar to Seminole are Tohono O'odham (15.0%, a difference of 0.12%), Dutch West Indian (15.0%, a difference of 0.26%), Cajun (14.9%, a difference of 0.67%), Colville (15.1%, a difference of 0.67%), and Cherokee (14.9%, a difference of 0.69%).
| Demographics | Rating | Rank | Female Disability |
| Osage | 0.0 /100 | #329 | Tragic 14.3% |
| Yuman | 0.0 /100 | #330 | Tragic 14.5% |
| Immigrants | Cabo Verde | 0.0 /100 | #331 | Tragic 14.6% |
| Pima | 0.0 /100 | #332 | Tragic 14.8% |
| Immigrants | Azores | 0.0 /100 | #333 | Tragic 14.9% |
| Cherokee | 0.0 /100 | #334 | Tragic 14.9% |
| Cajuns | 0.0 /100 | #335 | Tragic 14.9% |
| Seminole | 0.0 /100 | #336 | Tragic 15.0% |
| Tohono O'odham | 0.0 /100 | #337 | Tragic 15.0% |
| Dutch West Indians | 0.0 /100 | #338 | Tragic 15.0% |
| Colville | 0.0 /100 | #339 | Tragic 15.1% |
| Chickasaw | 0.0 /100 | #340 | Tragic 15.2% |
| Choctaw | 0.0 /100 | #341 | Tragic 15.4% |
| Creek | 0.0 /100 | #342 | Tragic 15.7% |
| Lumbee | 0.0 /100 | #343 | Tragic 15.8% |