Immigrants from Russia vs English Ambulatory Disability
COMPARE
Immigrants from Russia
English
Ambulatory Disability
Ambulatory Disability Comparison
Immigrants from Russia
English
5.9%
AMBULATORY DISABILITY
92.4/ 100
METRIC RATING
123rd/ 347
METRIC RANK
6.6%
AMBULATORY DISABILITY
0.4/ 100
METRIC RATING
262nd/ 347
METRIC RANK
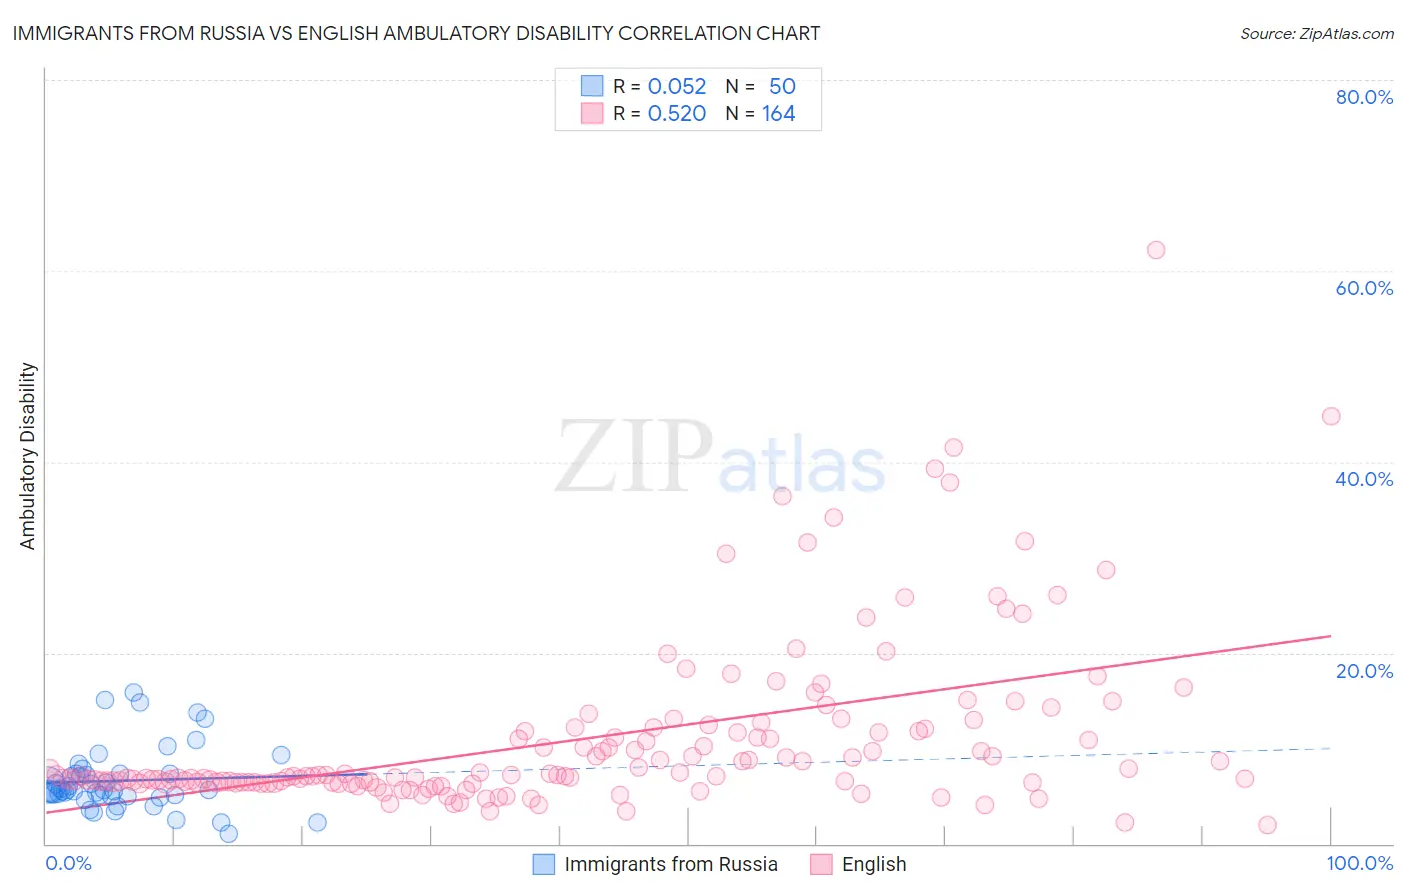
Immigrants from Russia vs English Ambulatory Disability Correlation Chart
The statistical analysis conducted on geographies consisting of 347,844,445 people shows a slight positive correlation between the proportion of Immigrants from Russia and percentage of population with ambulatory disability in the United States with a correlation coefficient (R) of 0.052 and weighted average of 5.9%. Similarly, the statistical analysis conducted on geographies consisting of 579,179,335 people shows a substantial positive correlation between the proportion of English and percentage of population with ambulatory disability in the United States with a correlation coefficient (R) of 0.520 and weighted average of 6.6%, a difference of 11.1%.
Ambulatory Disability Correlation Summary
| Measurement | Immigrants from Russia | English |
| Minimum | 1.0% | 2.0% |
| Maximum | 15.9% | 62.2% |
| Range | 14.8% | 60.2% |
| Mean | 6.6% | 11.0% |
| Median | 5.6% | 7.1% |
| Interquartile 25% (IQ1) | 5.0% | 6.4% |
| Interquartile 75% (IQ3) | 7.4% | 11.9% |
| Interquartile Range (IQR) | 2.4% | 5.5% |
| Standard Deviation (Sample) | 3.3% | 9.0% |
| Standard Deviation (Population) | 3.3% | 8.9% |
Similar Demographics by Ambulatory Disability
Demographics Similar to Immigrants from Russia by Ambulatory Disability
In terms of ambulatory disability, the demographic groups most similar to Immigrants from Russia are Costa Rican (5.9%, a difference of 0.020%), Icelander (5.9%, a difference of 0.020%), Immigrants from Middle Africa (5.9%, a difference of 0.040%), Estonian (5.9%, a difference of 0.10%), and Norwegian (5.9%, a difference of 0.13%).
| Demographics | Rating | Rank | Ambulatory Disability |
| Immigrants | Africa | 94.7 /100 | #116 | Exceptional 5.9% |
| Immigrants | South Eastern Asia | 93.6 /100 | #117 | Exceptional 5.9% |
| Russians | 93.4 /100 | #118 | Exceptional 5.9% |
| Norwegians | 93.1 /100 | #119 | Exceptional 5.9% |
| Estonians | 92.9 /100 | #120 | Exceptional 5.9% |
| Costa Ricans | 92.6 /100 | #121 | Exceptional 5.9% |
| Icelanders | 92.6 /100 | #122 | Exceptional 5.9% |
| Immigrants | Russia | 92.4 /100 | #123 | Exceptional 5.9% |
| Immigrants | Middle Africa | 92.2 /100 | #124 | Exceptional 5.9% |
| Koreans | 91.6 /100 | #125 | Exceptional 5.9% |
| Arabs | 91.5 /100 | #126 | Exceptional 5.9% |
| Immigrants | Nigeria | 90.9 /100 | #127 | Exceptional 5.9% |
| Immigrants | Western Asia | 90.7 /100 | #128 | Exceptional 5.9% |
| Immigrants | Norway | 90.5 /100 | #129 | Exceptional 5.9% |
| Immigrants | Kazakhstan | 89.7 /100 | #130 | Excellent 5.9% |
Demographics Similar to English by Ambulatory Disability
In terms of ambulatory disability, the demographic groups most similar to English are Hmong (6.6%, a difference of 0.12%), Irish (6.6%, a difference of 0.17%), Immigrants from Belize (6.6%, a difference of 0.24%), Aleut (6.6%, a difference of 0.25%), and Spanish American Indian (6.5%, a difference of 0.43%).
| Demographics | Rating | Rank | Ambulatory Disability |
| Welsh | 0.6 /100 | #255 | Tragic 6.5% |
| Immigrants | Uzbekistan | 0.6 /100 | #256 | Tragic 6.5% |
| Bermudans | 0.5 /100 | #257 | Tragic 6.5% |
| Spanish American Indians | 0.5 /100 | #258 | Tragic 6.5% |
| Aleuts | 0.4 /100 | #259 | Tragic 6.6% |
| Immigrants | Belize | 0.4 /100 | #260 | Tragic 6.6% |
| Irish | 0.4 /100 | #261 | Tragic 6.6% |
| English | 0.4 /100 | #262 | Tragic 6.6% |
| Hmong | 0.3 /100 | #263 | Tragic 6.6% |
| Nepalese | 0.2 /100 | #264 | Tragic 6.6% |
| Bahamians | 0.2 /100 | #265 | Tragic 6.6% |
| Guyanese | 0.2 /100 | #266 | Tragic 6.6% |
| Trinidadians and Tobagonians | 0.2 /100 | #267 | Tragic 6.6% |
| Spanish | 0.2 /100 | #268 | Tragic 6.6% |
| French | 0.1 /100 | #269 | Tragic 6.6% |