German vs Basque Ambulatory Disability
COMPARE
German
Basque
Ambulatory Disability
Ambulatory Disability Comparison
Germans
Basques
6.5%
AMBULATORY DISABILITY
1.5/ 100
METRIC RATING
243rd/ 347
METRIC RANK
6.1%
AMBULATORY DISABILITY
63.7/ 100
METRIC RATING
164th/ 347
METRIC RANK
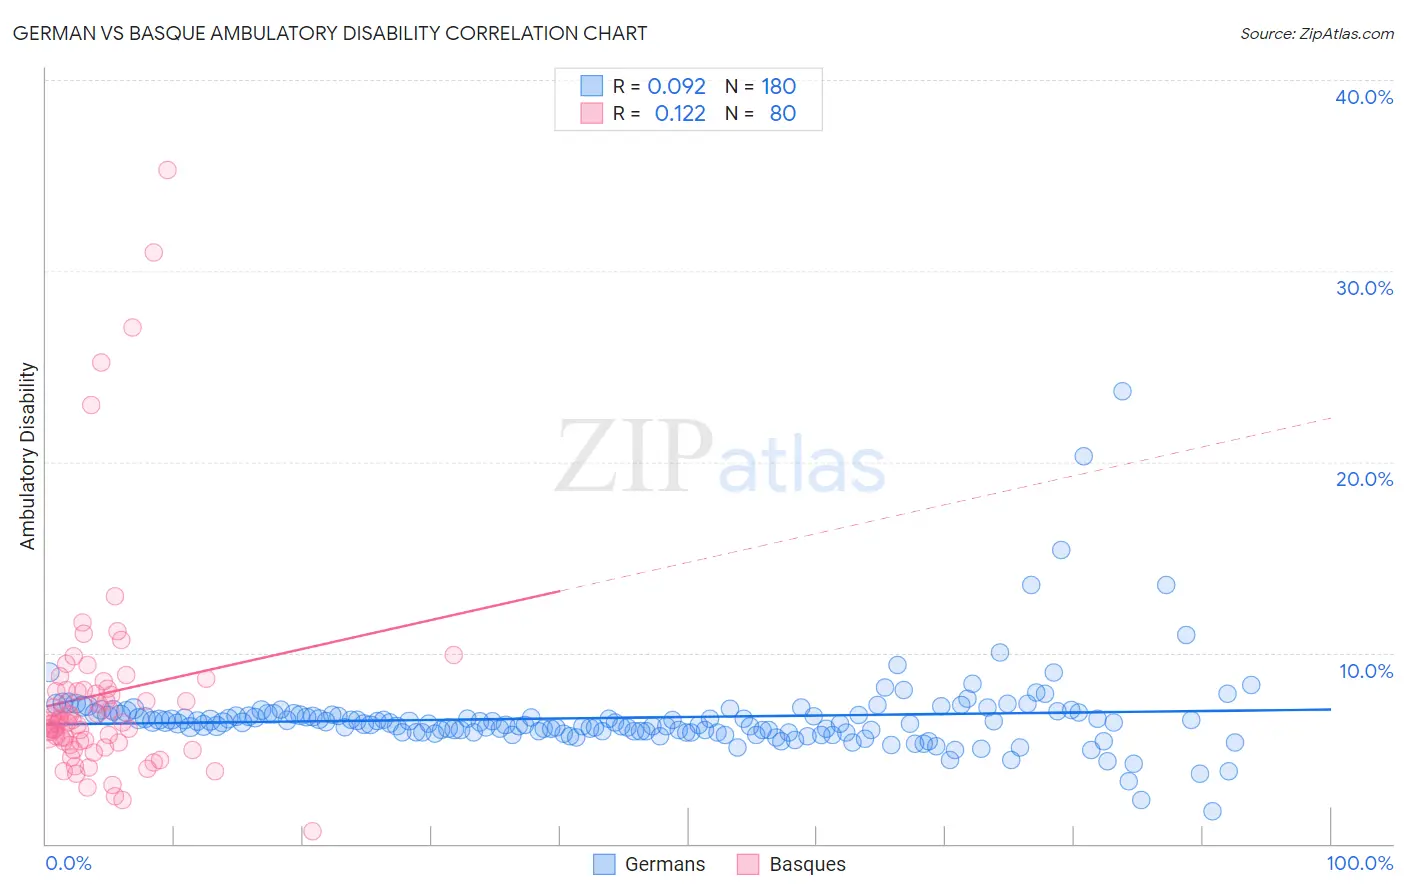
German vs Basque Ambulatory Disability Correlation Chart
The statistical analysis conducted on geographies consisting of 580,433,029 people shows a slight positive correlation between the proportion of Germans and percentage of population with ambulatory disability in the United States with a correlation coefficient (R) of 0.092 and weighted average of 6.5%. Similarly, the statistical analysis conducted on geographies consisting of 165,766,481 people shows a poor positive correlation between the proportion of Basques and percentage of population with ambulatory disability in the United States with a correlation coefficient (R) of 0.122 and weighted average of 6.1%, a difference of 6.3%.
Ambulatory Disability Correlation Summary
| Measurement | German | Basque |
| Minimum | 1.7% | 0.67% |
| Maximum | 23.7% | 35.3% |
| Range | 22.0% | 34.6% |
| Mean | 6.6% | 7.8% |
| Median | 6.3% | 6.4% |
| Interquartile 25% (IQ1) | 5.9% | 5.3% |
| Interquartile 75% (IQ3) | 6.8% | 8.0% |
| Interquartile Range (IQR) | 0.93% | 2.7% |
| Standard Deviation (Sample) | 2.2% | 5.8% |
| Standard Deviation (Population) | 2.2% | 5.8% |
Similar Demographics by Ambulatory Disability
Demographics Similar to Germans by Ambulatory Disability
In terms of ambulatory disability, the demographic groups most similar to Germans are Immigrants from Panama (6.5%, a difference of 0.0%), Spaniard (6.5%, a difference of 0.020%), Tlingit-Haida (6.5%, a difference of 0.040%), Immigrants from Haiti (6.5%, a difference of 0.050%), and Armenian (6.5%, a difference of 0.050%).
| Demographics | Rating | Rank | Ambulatory Disability |
| Dutch | 2.0 /100 | #236 | Tragic 6.4% |
| Immigrants | Germany | 1.8 /100 | #237 | Tragic 6.4% |
| Haitians | 1.8 /100 | #238 | Tragic 6.4% |
| Senegalese | 1.7 /100 | #239 | Tragic 6.4% |
| Immigrants | Senegal | 1.7 /100 | #240 | Tragic 6.4% |
| Immigrants | Haiti | 1.6 /100 | #241 | Tragic 6.5% |
| Spaniards | 1.6 /100 | #242 | Tragic 6.5% |
| Germans | 1.5 /100 | #243 | Tragic 6.5% |
| Immigrants | Panama | 1.5 /100 | #244 | Tragic 6.5% |
| Tlingit-Haida | 1.5 /100 | #245 | Tragic 6.5% |
| Armenians | 1.5 /100 | #246 | Tragic 6.5% |
| Immigrants | Cuba | 1.4 /100 | #247 | Tragic 6.5% |
| Immigrants | Portugal | 1.4 /100 | #248 | Tragic 6.5% |
| Native Hawaiians | 1.1 /100 | #249 | Tragic 6.5% |
| Chinese | 1.0 /100 | #250 | Tragic 6.5% |
Demographics Similar to Basques by Ambulatory Disability
In terms of ambulatory disability, the demographic groups most similar to Basques are Nicaraguan (6.1%, a difference of 0.030%), Iraqi (6.1%, a difference of 0.050%), Lebanese (6.1%, a difference of 0.15%), Immigrants from Oceania (6.1%, a difference of 0.17%), and Ecuadorian (6.1%, a difference of 0.18%).
| Demographics | Rating | Rank | Ambulatory Disability |
| Ghanaians | 71.3 /100 | #157 | Good 6.0% |
| Immigrants | Fiji | 71.2 /100 | #158 | Good 6.0% |
| Immigrants | Latvia | 71.1 /100 | #159 | Good 6.0% |
| Central Americans | 69.8 /100 | #160 | Good 6.0% |
| Immigrants | Belarus | 69.2 /100 | #161 | Good 6.1% |
| Nigerians | 67.1 /100 | #162 | Good 6.1% |
| Lebanese | 66.2 /100 | #163 | Good 6.1% |
| Basques | 63.7 /100 | #164 | Good 6.1% |
| Nicaraguans | 63.2 /100 | #165 | Good 6.1% |
| Iraqis | 62.8 /100 | #166 | Good 6.1% |
| Immigrants | Oceania | 60.7 /100 | #167 | Good 6.1% |
| Ecuadorians | 60.5 /100 | #168 | Good 6.1% |
| Immigrants | Southern Europe | 58.1 /100 | #169 | Average 6.1% |
| Immigrants | Ecuador | 53.8 /100 | #170 | Average 6.1% |
| Moroccans | 52.6 /100 | #171 | Average 6.1% |