British West Indian vs Salvadoran Disability Age Under 5
COMPARE
British West Indian
Salvadoran
Disability Age Under 5
Disability Age Under 5 Comparison
British West Indians
Salvadorans
0.99%
DISABILITY AGE UNDER 5
100.0/ 100
METRIC RATING
21st/ 347
METRIC RANK
1.1%
DISABILITY AGE UNDER 5
99.5/ 100
METRIC RATING
55th/ 347
METRIC RANK
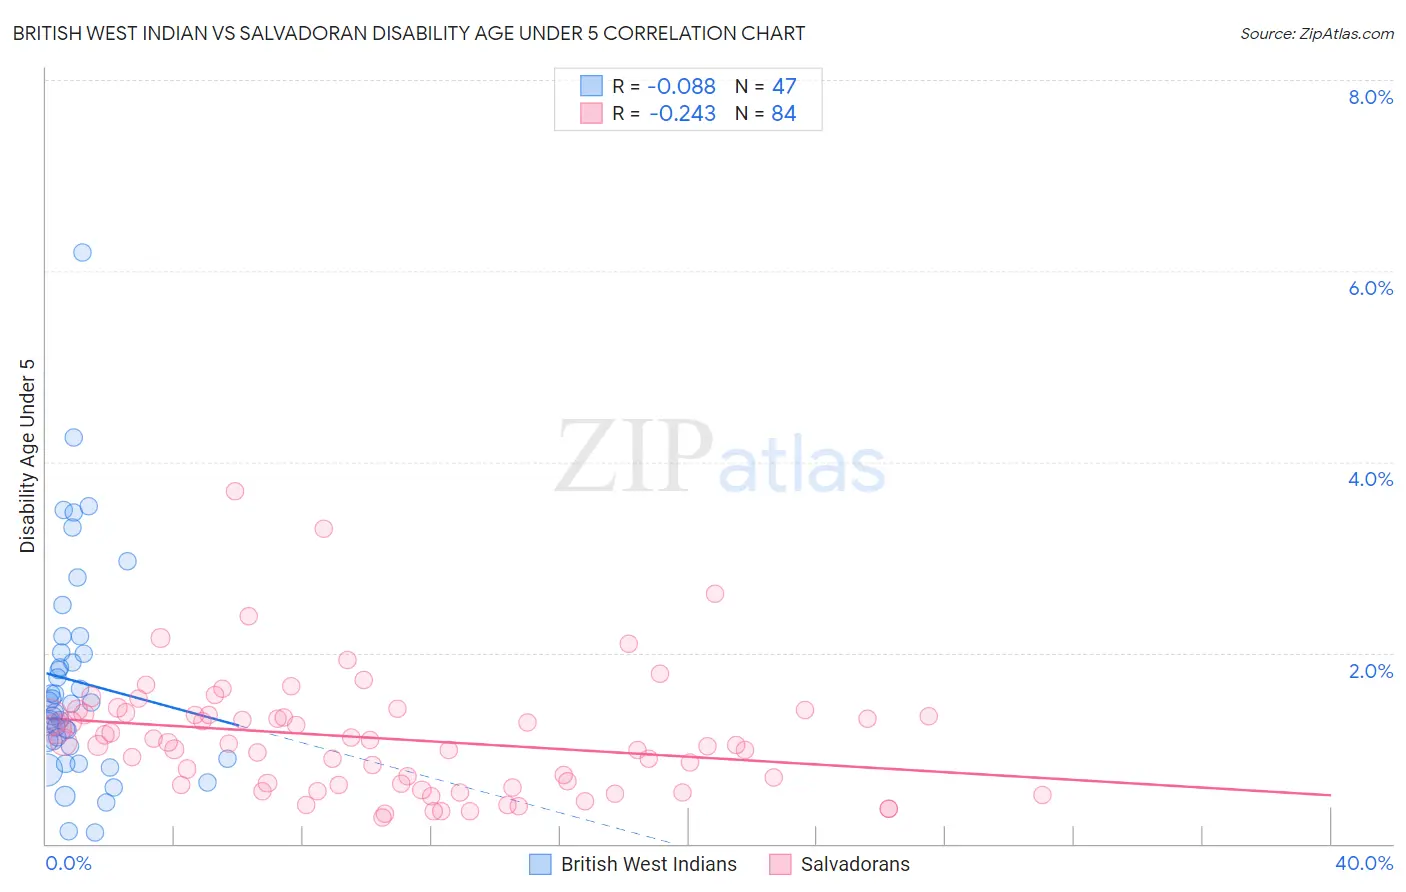
British West Indian vs Salvadoran Disability Age Under 5 Correlation Chart
The statistical analysis conducted on geographies consisting of 105,175,944 people shows a slight negative correlation between the proportion of British West Indians and percentage of population with a disability under the age of 5 in the United States with a correlation coefficient (R) of -0.088 and weighted average of 0.99%. Similarly, the statistical analysis conducted on geographies consisting of 220,785,812 people shows a weak negative correlation between the proportion of Salvadorans and percentage of population with a disability under the age of 5 in the United States with a correlation coefficient (R) of -0.243 and weighted average of 1.1%, a difference of 10.0%.
Disability Age Under 5 Correlation Summary
| Measurement | British West Indian | Salvadoran |
| Minimum | 0.12% | 0.27% |
| Maximum | 6.2% | 3.7% |
| Range | 6.1% | 3.4% |
| Mean | 1.7% | 1.1% |
| Median | 1.5% | 1.0% |
| Interquartile 25% (IQ1) | 1.0% | 0.62% |
| Interquartile 75% (IQ3) | 2.0% | 1.4% |
| Interquartile Range (IQR) | 0.98% | 0.74% |
| Standard Deviation (Sample) | 1.1% | 0.63% |
| Standard Deviation (Population) | 1.1% | 0.62% |
Similar Demographics by Disability Age Under 5
Demographics Similar to British West Indians by Disability Age Under 5
In terms of disability age under 5, the demographic groups most similar to British West Indians are Immigrants from Iran (1.00%, a difference of 0.79%), Yakama (1.00%, a difference of 0.87%), Indian (Asian) (1.0%, a difference of 1.1%), Immigrants from Micronesia (1.0%, a difference of 1.5%), and Immigrants from Taiwan (1.0%, a difference of 1.6%).
| Demographics | Rating | Rank | Disability Age Under 5 |
| Yuman | 100.0 /100 | #14 | Exceptional 0.95% |
| Immigrants | Hong Kong | 100.0 /100 | #15 | Exceptional 0.95% |
| Immigrants | Israel | 100.0 /100 | #16 | Exceptional 0.96% |
| Immigrants | China | 100.0 /100 | #17 | Exceptional 0.96% |
| Immigrants | Barbados | 100.0 /100 | #18 | Exceptional 0.97% |
| Puget Sound Salish | 100.0 /100 | #19 | Exceptional 0.97% |
| Nepalese | 100.0 /100 | #20 | Exceptional 0.97% |
| British West Indians | 100.0 /100 | #21 | Exceptional 0.99% |
| Immigrants | Iran | 100.0 /100 | #22 | Exceptional 1.00% |
| Yakama | 100.0 /100 | #23 | Exceptional 1.00% |
| Indians (Asian) | 100.0 /100 | #24 | Exceptional 1.0% |
| Immigrants | Micronesia | 100.0 /100 | #25 | Exceptional 1.0% |
| Immigrants | Taiwan | 100.0 /100 | #26 | Exceptional 1.0% |
| Guyanese | 100.0 /100 | #27 | Exceptional 1.0% |
| Immigrants | Eastern Asia | 100.0 /100 | #28 | Exceptional 1.0% |
Demographics Similar to Salvadorans by Disability Age Under 5
In terms of disability age under 5, the demographic groups most similar to Salvadorans are Immigrants from El Salvador (1.1%, a difference of 0.090%), Asian (1.1%, a difference of 0.38%), Ecuadorian (1.1%, a difference of 0.39%), Assyrian/Chaldean/Syriac (1.1%, a difference of 0.42%), and Immigrants from Egypt (1.1%, a difference of 0.61%).
| Demographics | Rating | Rank | Disability Age Under 5 |
| Immigrants | Singapore | 99.7 /100 | #48 | Exceptional 1.1% |
| Immigrants | Russia | 99.7 /100 | #49 | Exceptional 1.1% |
| Immigrants | Japan | 99.7 /100 | #50 | Exceptional 1.1% |
| Immigrants | Kazakhstan | 99.7 /100 | #51 | Exceptional 1.1% |
| Immigrants | Bolivia | 99.6 /100 | #52 | Exceptional 1.1% |
| Asians | 99.6 /100 | #53 | Exceptional 1.1% |
| Immigrants | El Salvador | 99.6 /100 | #54 | Exceptional 1.1% |
| Salvadorans | 99.5 /100 | #55 | Exceptional 1.1% |
| Ecuadorians | 99.5 /100 | #56 | Exceptional 1.1% |
| Assyrians/Chaldeans/Syriacs | 99.5 /100 | #57 | Exceptional 1.1% |
| Immigrants | Egypt | 99.4 /100 | #58 | Exceptional 1.1% |
| Immigrants | Malaysia | 99.4 /100 | #59 | Exceptional 1.1% |
| Immigrants | Western Asia | 99.2 /100 | #60 | Exceptional 1.1% |
| Immigrants | Ethiopia | 99.2 /100 | #61 | Exceptional 1.1% |
| Immigrants | Switzerland | 99.2 /100 | #62 | Exceptional 1.1% |