Immigrants from Ecuador vs Marshallese Hearing Disability
COMPARE
Immigrants from Ecuador
Marshallese
Hearing Disability
Hearing Disability Comparison
Immigrants from Ecuador
Marshallese
2.5%
HEARING DISABILITY
99.9/ 100
METRIC RATING
10th/ 347
METRIC RANK
3.8%
HEARING DISABILITY
0.0/ 100
METRIC RATING
306th/ 347
METRIC RANK
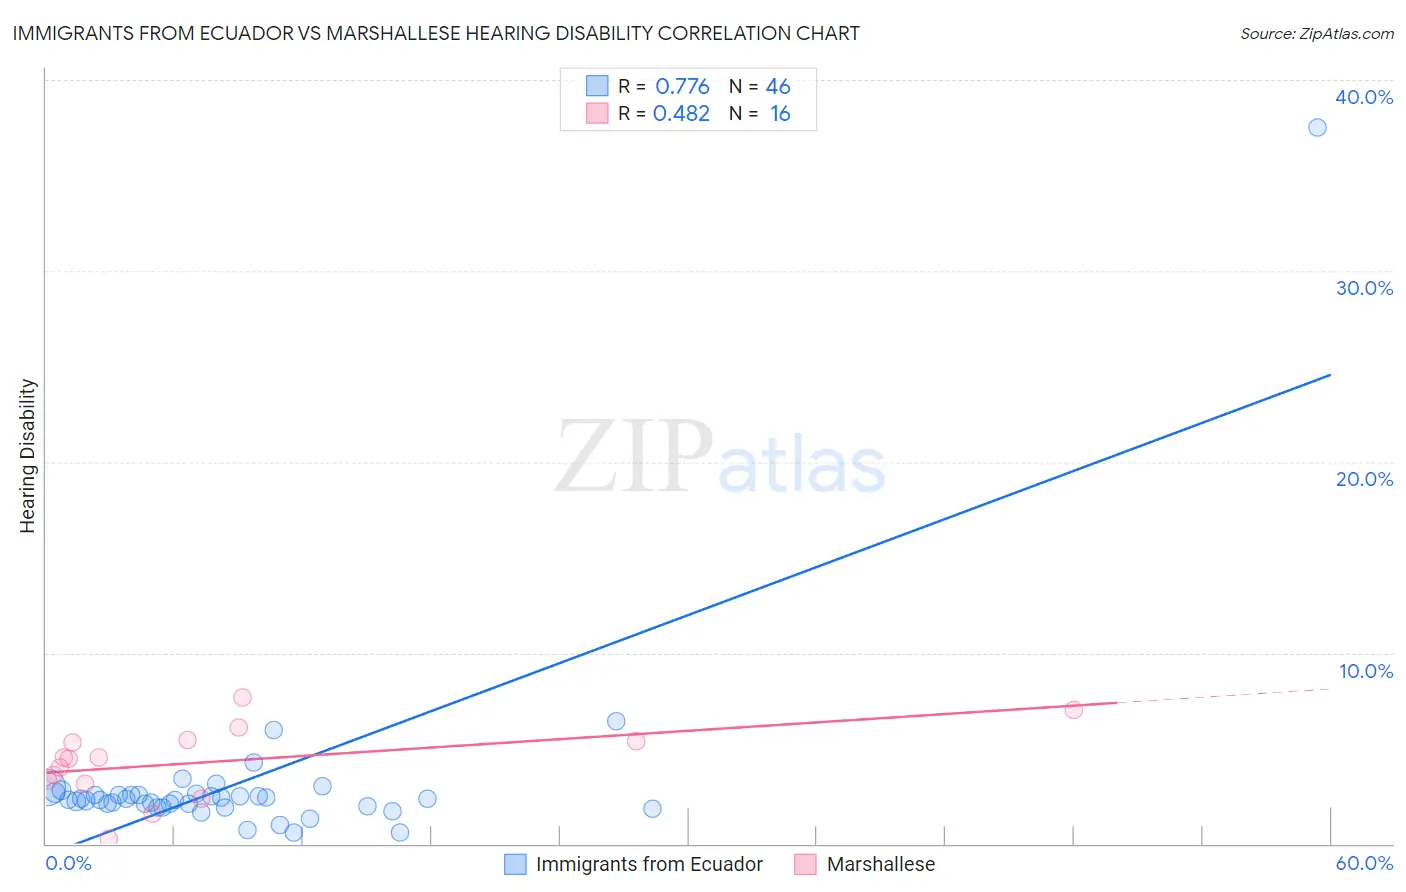
Immigrants from Ecuador vs Marshallese Hearing Disability Correlation Chart
The statistical analysis conducted on geographies consisting of 270,917,145 people shows a strong positive correlation between the proportion of Immigrants from Ecuador and percentage of population with hearing disability in the United States with a correlation coefficient (R) of 0.776 and weighted average of 2.5%. Similarly, the statistical analysis conducted on geographies consisting of 14,761,315 people shows a moderate positive correlation between the proportion of Marshallese and percentage of population with hearing disability in the United States with a correlation coefficient (R) of 0.482 and weighted average of 3.8%, a difference of 53.9%.
Hearing Disability Correlation Summary
| Measurement | Immigrants from Ecuador | Marshallese |
| Minimum | 0.57% | 0.29% |
| Maximum | 37.5% | 7.7% |
| Range | 36.9% | 7.4% |
| Mean | 3.2% | 4.3% |
| Median | 2.3% | 4.5% |
| Interquartile 25% (IQ1) | 2.0% | 3.2% |
| Interquartile 75% (IQ3) | 2.6% | 5.4% |
| Interquartile Range (IQR) | 0.59% | 2.2% |
| Standard Deviation (Sample) | 5.3% | 1.9% |
| Standard Deviation (Population) | 5.2% | 1.9% |
Similar Demographics by Hearing Disability
Demographics Similar to Immigrants from Ecuador by Hearing Disability
In terms of hearing disability, the demographic groups most similar to Immigrants from Ecuador are Immigrants from Trinidad and Tobago (2.5%, a difference of 0.55%), Trinidadian and Tobagonian (2.5%, a difference of 0.86%), Immigrants from Dominican Republic (2.4%, a difference of 1.0%), Sierra Leonean (2.5%, a difference of 1.1%), and Ecuadorian (2.5%, a difference of 1.4%).
| Demographics | Rating | Rank | Hearing Disability |
| Guyanese | 100.0 /100 | #3 | Exceptional 2.3% |
| Immigrants | Guyana | 100.0 /100 | #4 | Exceptional 2.3% |
| Immigrants | Barbados | 100.0 /100 | #5 | Exceptional 2.4% |
| Vietnamese | 100.0 /100 | #6 | Exceptional 2.4% |
| Immigrants | Bangladesh | 100.0 /100 | #7 | Exceptional 2.4% |
| British West Indians | 100.0 /100 | #8 | Exceptional 2.4% |
| Immigrants | Dominican Republic | 100.0 /100 | #9 | Exceptional 2.4% |
| Immigrants | Ecuador | 99.9 /100 | #10 | Exceptional 2.5% |
| Immigrants | Trinidad and Tobago | 99.9 /100 | #11 | Exceptional 2.5% |
| Trinidadians and Tobagonians | 99.9 /100 | #12 | Exceptional 2.5% |
| Sierra Leoneans | 99.9 /100 | #13 | Exceptional 2.5% |
| Ecuadorians | 99.9 /100 | #14 | Exceptional 2.5% |
| Barbadians | 99.9 /100 | #15 | Exceptional 2.5% |
| Immigrants | West Indies | 99.9 /100 | #16 | Exceptional 2.5% |
| Immigrants | India | 99.9 /100 | #17 | Exceptional 2.5% |
Demographics Similar to Marshallese by Hearing Disability
In terms of hearing disability, the demographic groups most similar to Marshallese are French Canadian (3.8%, a difference of 0.12%), Ottawa (3.8%, a difference of 0.56%), Scotch-Irish (3.8%, a difference of 0.64%), English (3.8%, a difference of 0.86%), and Cree (3.8%, a difference of 0.95%).
| Demographics | Rating | Rank | Hearing Disability |
| Germans | 0.0 /100 | #299 | Tragic 3.7% |
| Scottish | 0.0 /100 | #300 | Tragic 3.7% |
| Pennsylvania Germans | 0.0 /100 | #301 | Tragic 3.7% |
| Dutch | 0.0 /100 | #302 | Tragic 3.7% |
| Menominee | 0.0 /100 | #303 | Tragic 3.7% |
| French | 0.0 /100 | #304 | Tragic 3.8% |
| English | 0.0 /100 | #305 | Tragic 3.8% |
| Marshallese | 0.0 /100 | #306 | Tragic 3.8% |
| French Canadians | 0.0 /100 | #307 | Tragic 3.8% |
| Ottawa | 0.0 /100 | #308 | Tragic 3.8% |
| Scotch-Irish | 0.0 /100 | #309 | Tragic 3.8% |
| Cree | 0.0 /100 | #310 | Tragic 3.8% |
| Americans | 0.0 /100 | #311 | Tragic 3.9% |
| Cajuns | 0.0 /100 | #312 | Tragic 3.9% |
| Hopi | 0.0 /100 | #313 | Tragic 3.9% |