Immigrants from Philippines vs Pakistani Male Disability
COMPARE
Immigrants from Philippines
Pakistani
Male Disability
Male Disability Comparison
Immigrants from Philippines
Pakistanis
10.9%
MALE DISABILITY
85.4/ 100
METRIC RATING
129th/ 347
METRIC RANK
11.3%
MALE DISABILITY
30.3/ 100
METRIC RATING
185th/ 347
METRIC RANK
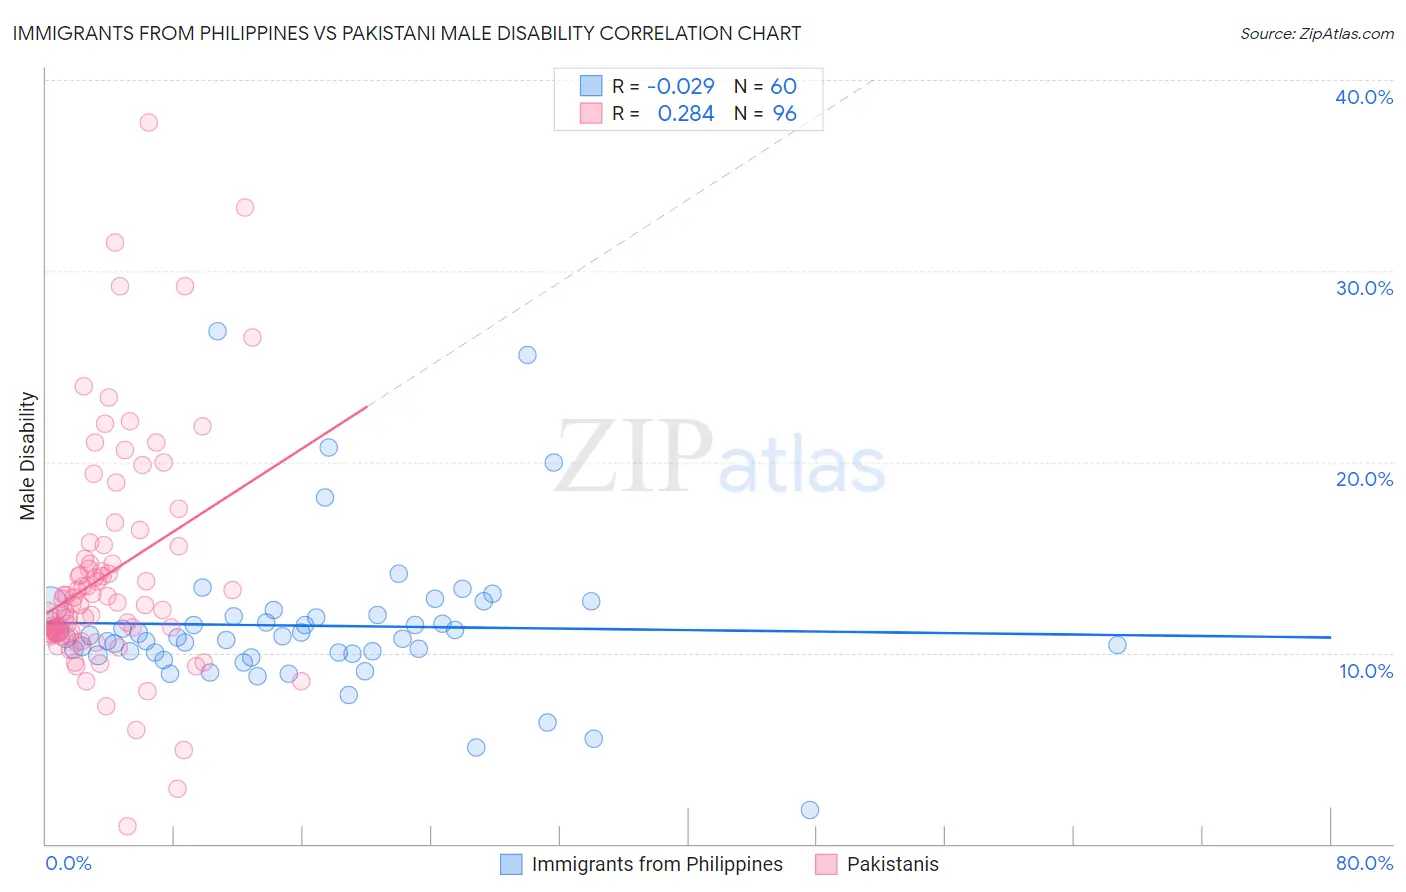
Immigrants from Philippines vs Pakistani Male Disability Correlation Chart
The statistical analysis conducted on geographies consisting of 471,154,961 people shows no correlation between the proportion of Immigrants from Philippines and percentage of males with a disability in the United States with a correlation coefficient (R) of -0.029 and weighted average of 10.9%. Similarly, the statistical analysis conducted on geographies consisting of 335,283,610 people shows a weak positive correlation between the proportion of Pakistanis and percentage of males with a disability in the United States with a correlation coefficient (R) of 0.284 and weighted average of 11.3%, a difference of 3.7%.
Male Disability Correlation Summary
| Measurement | Immigrants from Philippines | Pakistani |
| Minimum | 1.8% | 0.92% |
| Maximum | 26.8% | 37.8% |
| Range | 25.0% | 36.8% |
| Mean | 11.4% | 14.1% |
| Median | 10.8% | 12.5% |
| Interquartile 25% (IQ1) | 10.0% | 11.0% |
| Interquartile 75% (IQ3) | 12.0% | 15.2% |
| Interquartile Range (IQR) | 2.0% | 4.2% |
| Standard Deviation (Sample) | 4.0% | 6.1% |
| Standard Deviation (Population) | 4.0% | 6.0% |
Similar Demographics by Male Disability
Demographics Similar to Immigrants from Philippines by Male Disability
In terms of male disability, the demographic groups most similar to Immigrants from Philippines are Immigrants from Latvia (10.9%, a difference of 0.0%), Brazilian (10.9%, a difference of 0.0%), Macedonian (11.0%, a difference of 0.14%), Immigrants from Ukraine (10.9%, a difference of 0.16%), and Immigrants from Fiji (11.0%, a difference of 0.16%).
| Demographics | Rating | Rank | Male Disability |
| Immigrants | Ghana | 89.0 /100 | #122 | Excellent 10.9% |
| Immigrants | Czechoslovakia | 88.4 /100 | #123 | Excellent 10.9% |
| South American Indians | 88.1 /100 | #124 | Excellent 10.9% |
| Immigrants | North Macedonia | 88.1 /100 | #125 | Excellent 10.9% |
| Immigrants | Trinidad and Tobago | 86.9 /100 | #126 | Excellent 10.9% |
| Immigrants | Ukraine | 86.8 /100 | #127 | Excellent 10.9% |
| Immigrants | Latvia | 85.5 /100 | #128 | Excellent 10.9% |
| Immigrants | Philippines | 85.4 /100 | #129 | Excellent 10.9% |
| Brazilians | 85.4 /100 | #130 | Excellent 10.9% |
| Macedonians | 84.2 /100 | #131 | Excellent 11.0% |
| Immigrants | Fiji | 84.0 /100 | #132 | Excellent 11.0% |
| Ugandans | 83.9 /100 | #133 | Excellent 11.0% |
| Bhutanese | 83.4 /100 | #134 | Excellent 11.0% |
| Trinidadians and Tobagonians | 83.3 /100 | #135 | Excellent 11.0% |
| Immigrants | Costa Rica | 82.8 /100 | #136 | Excellent 11.0% |
Demographics Similar to Pakistanis by Male Disability
In terms of male disability, the demographic groups most similar to Pakistanis are Iraqi (11.3%, a difference of 0.010%), Immigrants from Central America (11.3%, a difference of 0.16%), Immigrants from Zaire (11.4%, a difference of 0.18%), Immigrants from Austria (11.4%, a difference of 0.20%), and Immigrants from Belize (11.3%, a difference of 0.21%).
| Demographics | Rating | Rank | Male Disability |
| Australians | 42.2 /100 | #178 | Average 11.3% |
| Immigrants | Caribbean | 41.4 /100 | #179 | Average 11.3% |
| Hondurans | 41.1 /100 | #180 | Average 11.3% |
| Immigrants | Senegal | 34.4 /100 | #181 | Fair 11.3% |
| Immigrants | Belize | 33.7 /100 | #182 | Fair 11.3% |
| Immigrants | Central America | 32.9 /100 | #183 | Fair 11.3% |
| Iraqis | 30.5 /100 | #184 | Fair 11.3% |
| Pakistanis | 30.3 /100 | #185 | Fair 11.3% |
| Immigrants | Zaire | 27.6 /100 | #186 | Fair 11.4% |
| Immigrants | Austria | 27.3 /100 | #187 | Fair 11.4% |
| Estonians | 26.8 /100 | #188 | Fair 11.4% |
| Immigrants | Netherlands | 25.9 /100 | #189 | Fair 11.4% |
| Immigrants | Bosnia and Herzegovina | 25.4 /100 | #190 | Fair 11.4% |
| Senegalese | 23.2 /100 | #191 | Fair 11.4% |
| Assyrians/Chaldeans/Syriacs | 23.2 /100 | #192 | Fair 11.4% |