Immigrants from Philippines vs Filipino Male Disability
COMPARE
Immigrants from Philippines
Filipino
Male Disability
Male Disability Comparison
Immigrants from Philippines
Filipinos
10.9%
MALE DISABILITY
85.4/ 100
METRIC RATING
129th/ 347
METRIC RANK
9.1%
MALE DISABILITY
100.0/ 100
METRIC RATING
3rd/ 347
METRIC RANK
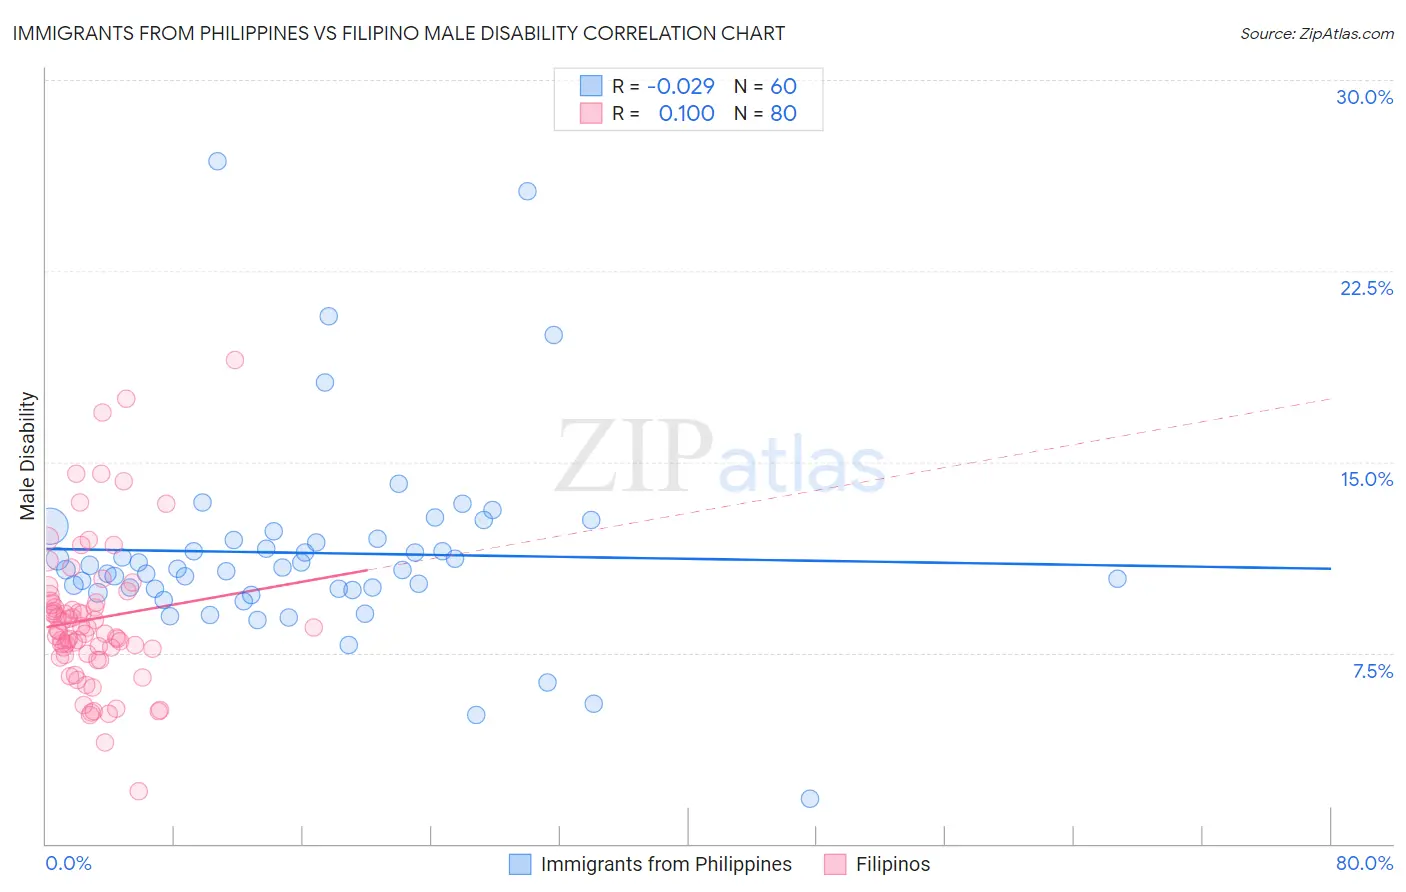
Immigrants from Philippines vs Filipino Male Disability Correlation Chart
The statistical analysis conducted on geographies consisting of 471,154,961 people shows no correlation between the proportion of Immigrants from Philippines and percentage of males with a disability in the United States with a correlation coefficient (R) of -0.029 and weighted average of 10.9%. Similarly, the statistical analysis conducted on geographies consisting of 254,333,979 people shows a poor positive correlation between the proportion of Filipinos and percentage of males with a disability in the United States with a correlation coefficient (R) of 0.100 and weighted average of 9.1%, a difference of 20.1%.
Male Disability Correlation Summary
| Measurement | Immigrants from Philippines | Filipino |
| Minimum | 1.8% | 2.1% |
| Maximum | 26.8% | 19.0% |
| Range | 25.0% | 16.9% |
| Mean | 11.4% | 8.8% |
| Median | 10.8% | 8.4% |
| Interquartile 25% (IQ1) | 10.0% | 7.4% |
| Interquartile 75% (IQ3) | 12.0% | 9.5% |
| Interquartile Range (IQR) | 2.0% | 2.1% |
| Standard Deviation (Sample) | 4.0% | 2.9% |
| Standard Deviation (Population) | 4.0% | 2.9% |
Similar Demographics by Male Disability
Demographics Similar to Immigrants from Philippines by Male Disability
In terms of male disability, the demographic groups most similar to Immigrants from Philippines are Immigrants from Latvia (10.9%, a difference of 0.0%), Brazilian (10.9%, a difference of 0.0%), Macedonian (11.0%, a difference of 0.14%), Immigrants from Ukraine (10.9%, a difference of 0.16%), and Immigrants from Fiji (11.0%, a difference of 0.16%).
| Demographics | Rating | Rank | Male Disability |
| Immigrants | Ghana | 89.0 /100 | #122 | Excellent 10.9% |
| Immigrants | Czechoslovakia | 88.4 /100 | #123 | Excellent 10.9% |
| South American Indians | 88.1 /100 | #124 | Excellent 10.9% |
| Immigrants | North Macedonia | 88.1 /100 | #125 | Excellent 10.9% |
| Immigrants | Trinidad and Tobago | 86.9 /100 | #126 | Excellent 10.9% |
| Immigrants | Ukraine | 86.8 /100 | #127 | Excellent 10.9% |
| Immigrants | Latvia | 85.5 /100 | #128 | Excellent 10.9% |
| Immigrants | Philippines | 85.4 /100 | #129 | Excellent 10.9% |
| Brazilians | 85.4 /100 | #130 | Excellent 10.9% |
| Macedonians | 84.2 /100 | #131 | Excellent 11.0% |
| Immigrants | Fiji | 84.0 /100 | #132 | Excellent 11.0% |
| Ugandans | 83.9 /100 | #133 | Excellent 11.0% |
| Bhutanese | 83.4 /100 | #134 | Excellent 11.0% |
| Trinidadians and Tobagonians | 83.3 /100 | #135 | Excellent 11.0% |
| Immigrants | Costa Rica | 82.8 /100 | #136 | Excellent 11.0% |
Demographics Similar to Filipinos by Male Disability
In terms of male disability, the demographic groups most similar to Filipinos are Immigrants from Taiwan (9.1%, a difference of 0.010%), Immigrants from India (9.0%, a difference of 0.90%), Thai (9.2%, a difference of 1.3%), Immigrants from Hong Kong (9.4%, a difference of 3.4%), and Immigrants from South Central Asia (9.4%, a difference of 3.5%).
| Demographics | Rating | Rank | Male Disability |
| Immigrants | India | 100.0 /100 | #1 | Exceptional 9.0% |
| Immigrants | Taiwan | 100.0 /100 | #2 | Exceptional 9.1% |
| Filipinos | 100.0 /100 | #3 | Exceptional 9.1% |
| Thais | 100.0 /100 | #4 | Exceptional 9.2% |
| Immigrants | Hong Kong | 100.0 /100 | #5 | Exceptional 9.4% |
| Immigrants | South Central Asia | 100.0 /100 | #6 | Exceptional 9.4% |
| Immigrants | Bolivia | 100.0 /100 | #7 | Exceptional 9.5% |
| Immigrants | China | 100.0 /100 | #8 | Exceptional 9.5% |
| Immigrants | Singapore | 100.0 /100 | #9 | Exceptional 9.5% |
| Immigrants | Israel | 100.0 /100 | #10 | Exceptional 9.6% |
| Immigrants | Eastern Asia | 100.0 /100 | #11 | Exceptional 9.6% |
| Bolivians | 100.0 /100 | #12 | Exceptional 9.6% |
| Iranians | 100.0 /100 | #13 | Exceptional 9.7% |
| Immigrants | Iran | 100.0 /100 | #14 | Exceptional 9.7% |
| Indians (Asian) | 100.0 /100 | #15 | Exceptional 9.7% |